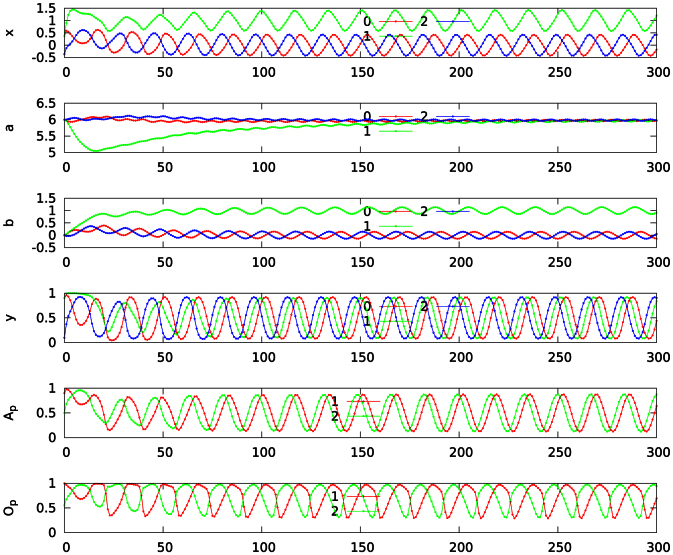
Figure 2. Time series of the three-site network shown in Fig. 1, for Γ = 1,  ,
,  , λ1 = 0, λ2 = 0 and w± = 1.
The dynamics is given by (6) and (11). The dynamics retraces periodically the original attractor states, as one can see from the oscillation of the overlap Op and the Ap, compare Eqs. (13) and (14), between the patterns of neural and attractor activities.

