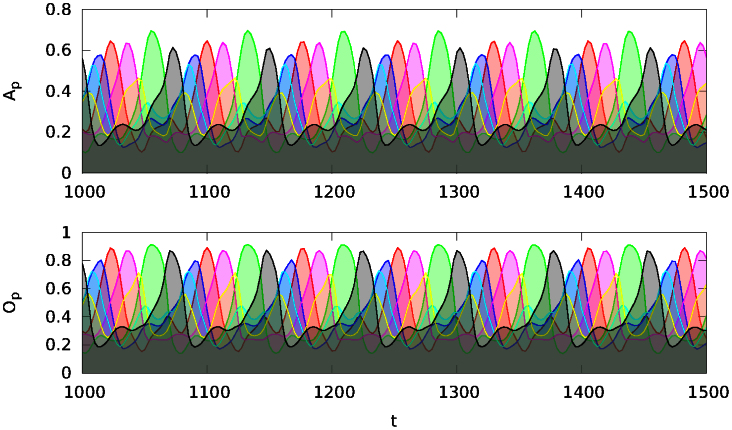
Figure 6.
Overlaps Op and Ap (color encoded, see Eqs. (13) and (14)), for a N = 100 network, of the neural activities with the Np = 7 attractor ruins, as a function of time t. The sparseness of the binary patterns defining the attractor ruins is α = 0.3. Here the average activity α of the attractor relicts and the target mean activity level μ = 0.3 have been selected to be equal, resulting in a limiting cycle with clean latching dynamics.

