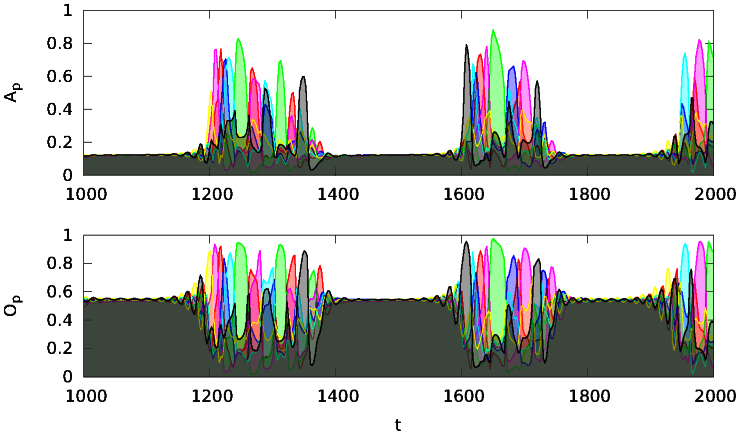
Figure 8.
Time evolution of overlaps Op and Ap (color coded, compare Eqs. (13) and (14)) for all NP = 7 binary patterns, with sparseness α = 0.3, for a network of N = 100 neurons. The target mean neural activity is μ = 0.15, the difference between the two objective functions, viz between μ and α induces stress. The intermittent latching dynamics has a mean activity of about 0.3, which is too large. The phases of laminar flows between the burst of latching has a reduced average activity, thus reducing the time-averaged mean activity level toward the target μ = 0.15.

