
Figure 1.
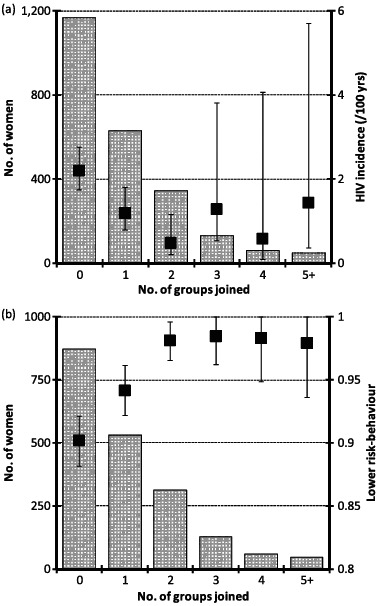
Dose effects of multiple community group membership on (a) HIV incidence and (b) reducing or maintaining low-risk behaviour, for women, 1998–2003. The scale bars in the histogram show the numbers of women by number of groups joined for each outcome. The square boxes with whiskers show the estimates and 95% confidence intervals, respectively, for HIV incidence (graph (a)) and adoption of lower risk-behaviour (graph (b)).