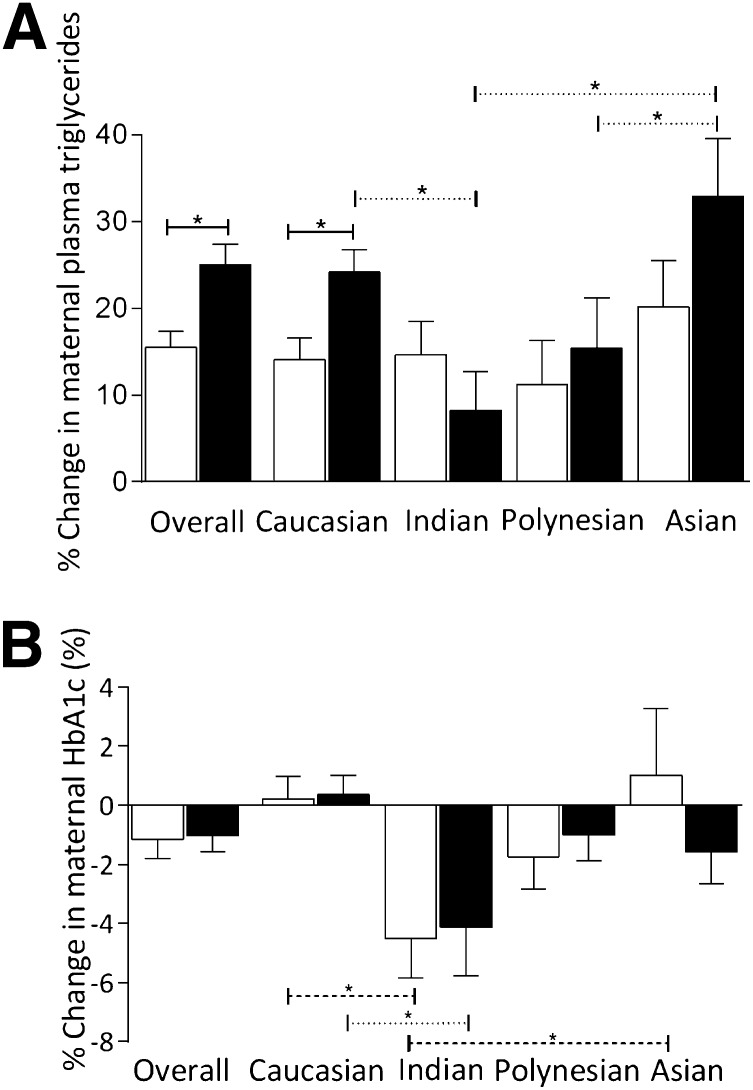
Figure 1.
Percent change in maternal triglycerides (mmol/L) (A) and maternal HbA1c (%) (B) from baseline to 36 weeks' gestation, stratified by ethnicity. White bars, insulin; black bars, metformin. Solid line compares between metformin and insulin, dashed line compares between ethnicities in women allocated insulin, and dotted line compares between ethnicities within women allocated metformin. *Significant at P < 0.05.

