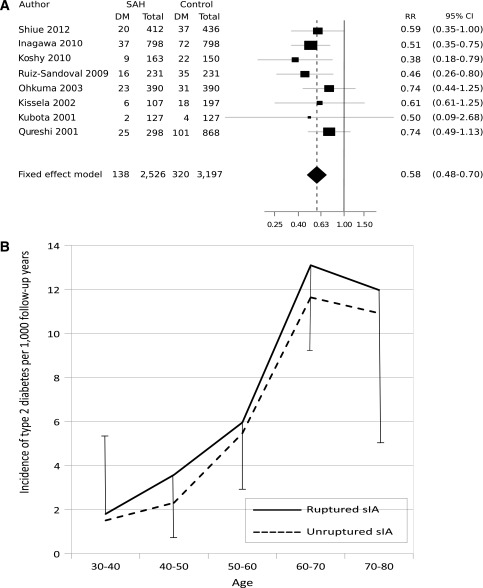
Figure 1.
A: Review of the literature of the association of diabetes and SAH in case-control studies published 2001–2012. The horizontal lines represent the 95% CIs of the OR or risk ratios (RRs). The size of the black box indicates the relative effect on the final fixed-effect estimate. The x-axis is logarithmic. B: Incidence of type 2 diabetes in 1,058 ruptured (aneurysmal SAH) and 484 unruptured sIA patients by age-group and 95% CIs.

