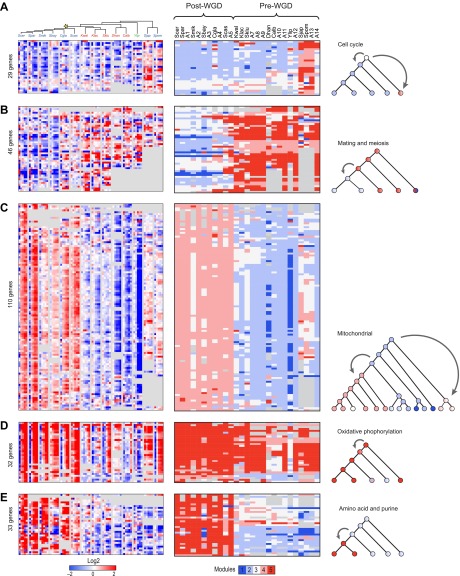
Figure 6. Conservation and rewiring of coherent functions across modules.
Shown are expression (left), Arboretum module assignments (middle) and a cartoon of the phylogenetic transition (right) for gene sets with coherent phylogenetic patterns. Each expression matrix is formatted as in Figure 3A, and each module assignment matrix as in Figure 4B–F. (A) Cell cycle genes, (B) mating and meiosis related genes, (C) mitochondrial genes, (D) oxidative phosphorylation genes, (E) amino acid and purine metabolism genes. Each module shows all the genes with a given phylogenetic pattern, and their labels (e.g., mitochondrial) were manually generated based on enrichment of GO terms.


