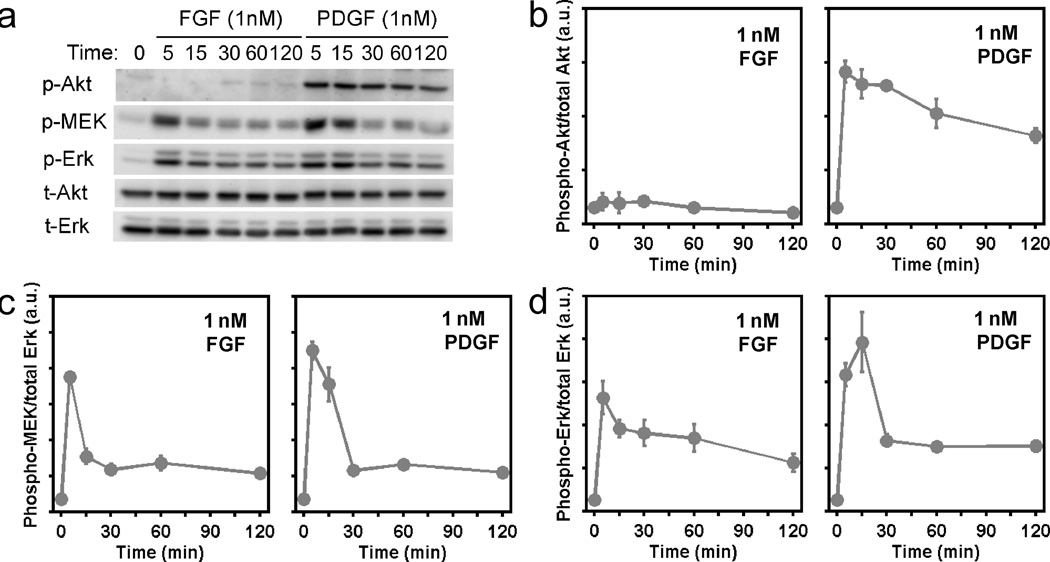
Figure 1. Quantitative comparison of FGF and PDGF receptor-mediated signalling in mouse fibroblasts under maximal stimulation conditions.
a. NIH 3T3 fibroblasts were maximally stimulated with FGF-2 or PDGF-BB (both 1 nM) in side-by-side experiments, and phosphorylation time courses of Akt1/2/3 (p-Akt), MEK1/2 (p-MEK), and ERK1/2 (p-Erk) were measured by quantitative immunoblotting alongside total Akt (t-Akt) and total ERK (t-Erk) as loading controls. The blots shown are representative of 6 independent experiments. b–d. Quantitative comparison of FGF- and PDGF-stimulated Akt (b), MEK (c), and ERK (d) phosphorylation kinetics. Values are normalized as previously described and are reported as mean ± s.e.m. in arbitrary units (n = 6).

