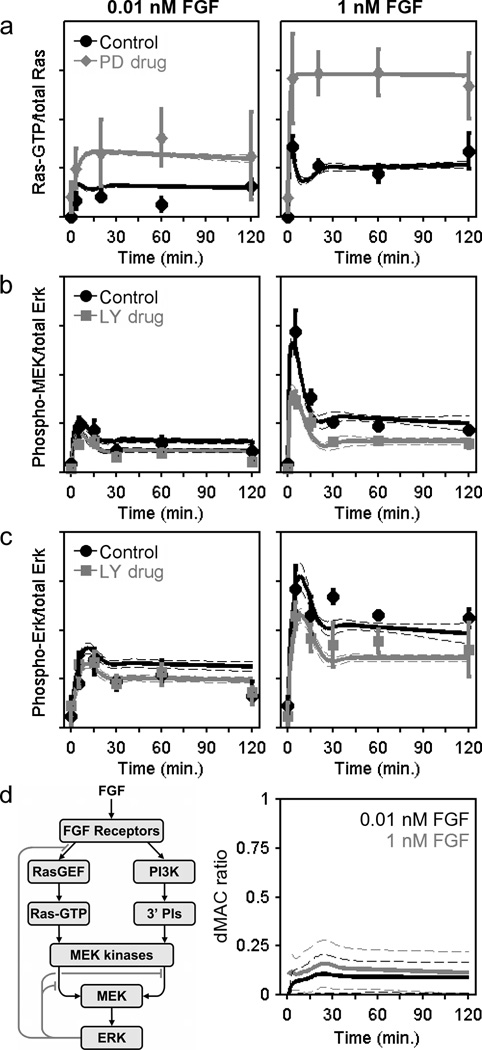
Figure 3. Kinetic model of the FGF receptor signalling network.
a–c. A simulated annealing algorithm was used to align the kinetic model (Supplementary Text S1) to the data as indicated, thus collecting an ensemble of parameter sets that fit the data set well. Solid curves are ensemble means, and the dashed curves are mean ± s.d. (n = 10,000). The data used to constrain the model, reported as normalized mean ± s.e.m. (n = 3). Ras-GTP measurements (a) were acquired for NIH 3T3 cells with MEK inhibited (50 µM PD098059) versus DMSO control (basal level subtracted). MEK (b) and ERK (c) phosphorylation kinetics were measured with PI3K inhibited versus DMSO control (representative blots shown in Fig. 2a). d. The schematic shows the basic structure of the model with Ras- and PI3K-dependent pathways to MEK/ERK and feedback desensitization of Ras-GEF and MEK kinase activities. The dynamic MEK activation comparator (dMAC; Supplementary Text S1) quantitatively compares the contributions of the two MEK activation pathways as a function of time (gray, 1 nM FGF; black, 0.01 nM FGF).

