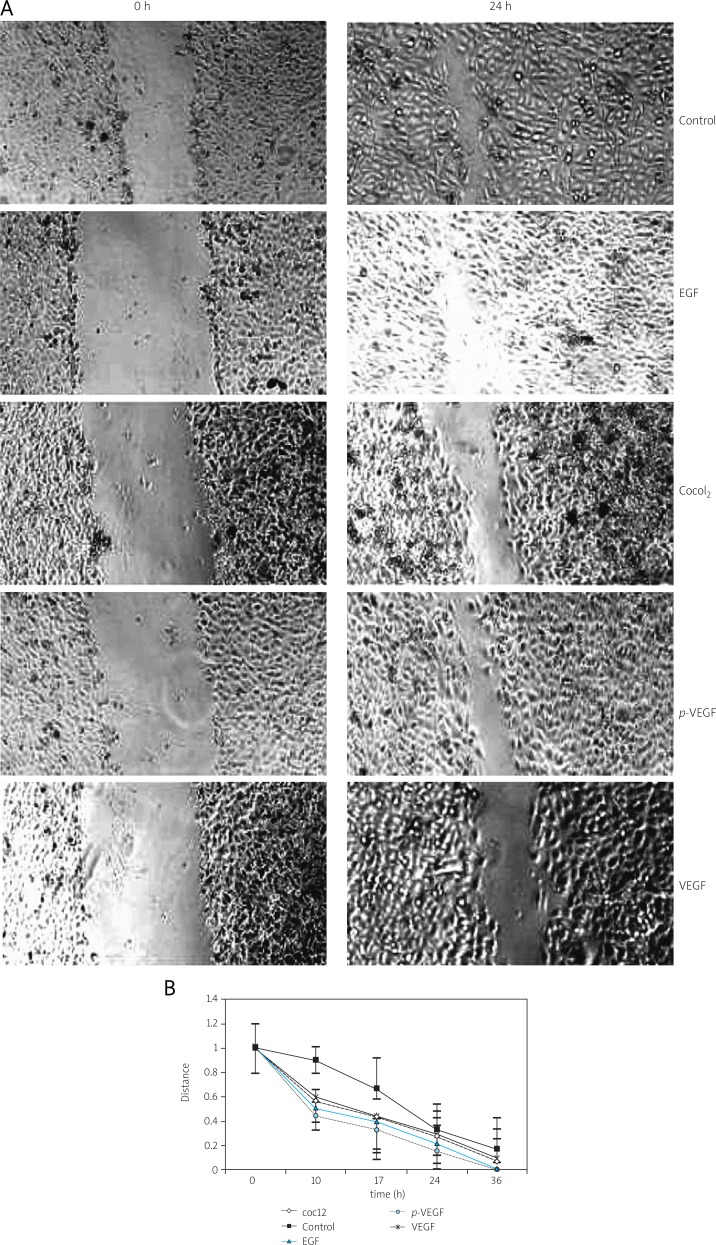
Fig. 3.
Effects of p-VEGF on tumor cell migration (p < 0.01). Figure 3A shows representative images of the wound region of B16 melanoma cells in different treatment groups 0 h and 24 h after wounding. Original magnification, ×40. Figure 3B (on the next page) shows the migration distance ratio to 0 h in different groups; the cells transfected with p-VEGF migrated more rapidly than the other groups (p < 0.01)

