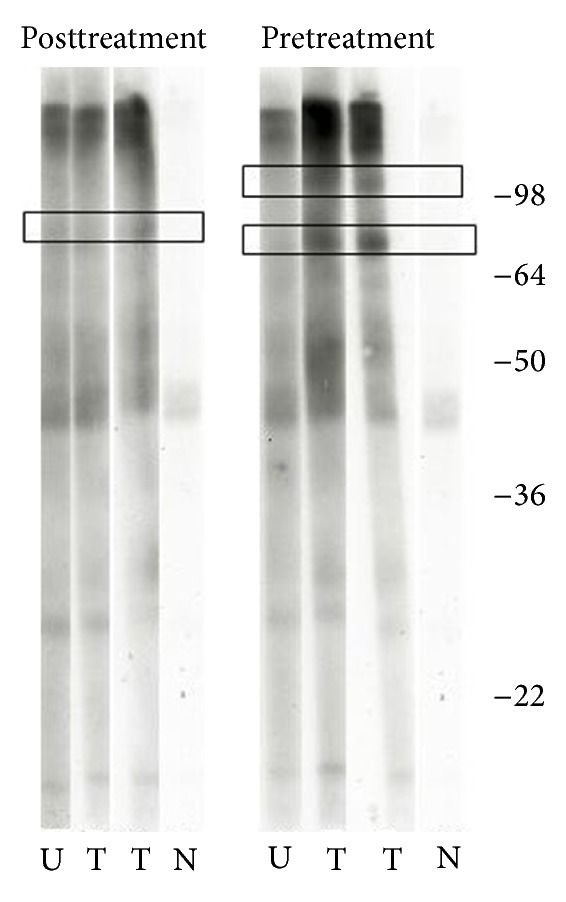
Figure 4.

Immunoblots of serum samples. Comparison of pre- (left) and post- (right) treatment immunoblots detected by their reactivity with IgE antibodies. Identified bands are shown in boxes and molecular weights (in kDa) are indicated at the right end. Strips were exposed on hyperfilm for seconds (touch exposure). U: untreated, T: treated, and N: assay control (no sample added).
