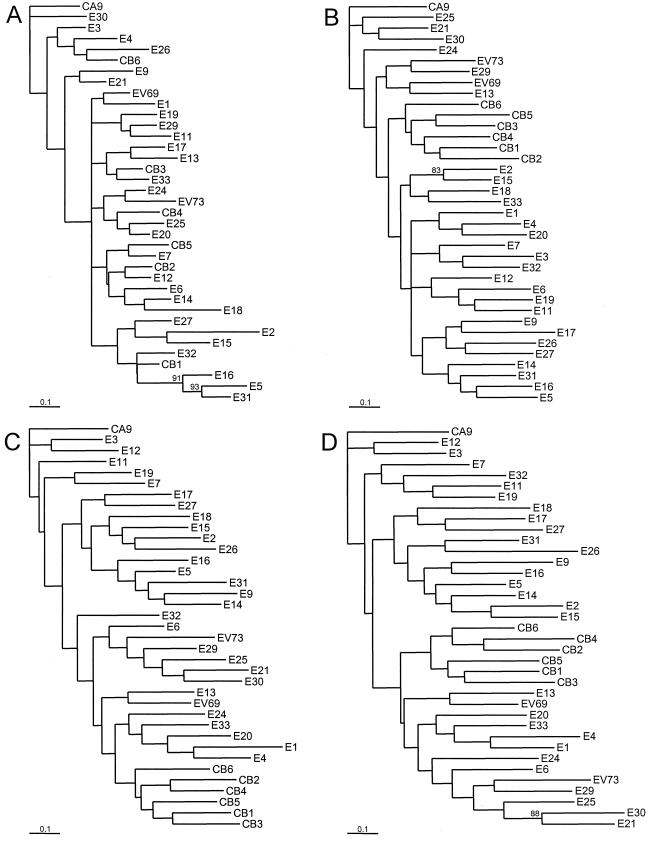
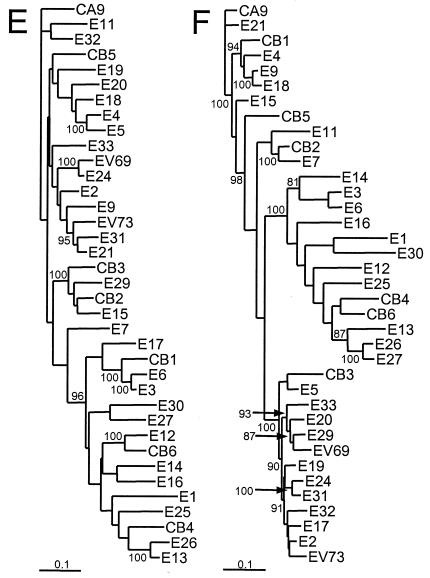
FIG. 3.
Phylogenetic trees based on HEV-B virus nucleotide sequences. The regions encoding each of the mature capsid proteins, the 2C protein, and the 3D protein were analyzed independently. Bootstrap values (percentages of 1,000 pseudoreplicate data sets) supporting each cluster are shown at the nodes; for clarity, only values of >80% are shown. All trees are plotted to the same scale (see scale bars). (A) 1A (VP4); (B) 1B (VP2); (C) 1C (VP3); (D) 1D (VP1); (E) 2C; (F) 3D.


