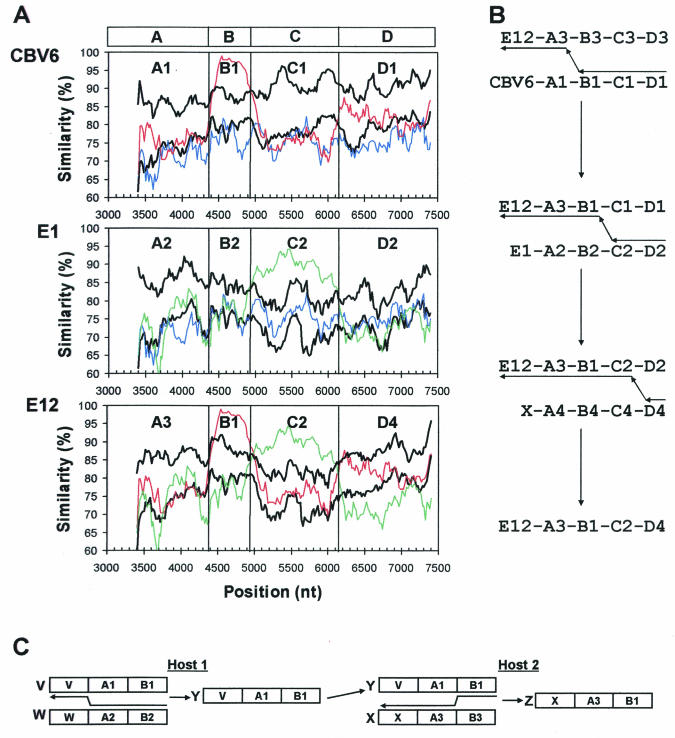
FIG. 5.
Putative recombination pathways for CBV6-Schmitt, E1-Farouk, and E12-Travis, deduced from similarity plots and bootscanning analysis and a simple, schematic representation of recombination involving three hypothetical parental strains. (A) Similarity plots, as in Fig. 4, comparing the relationships among CBV6-Schmitt, E1-Farouk, and E12-Travis with their relationships to the other prototype strains. The curves depicting comparisons between CBV6, E1, and E12 are color-coded as follows: blue, CBV6-E1; red, CBV6-E12; and green, E1-E12. For each query sequence, the average similarity to strains other than CBV6-Schmitt, E1-Farouk, and E12-Travis is plotted in the lower black curve; the upper black curve indicates three standard deviations above the mean. The boundaries of regions A, B, C, and D, at the top, indicate sites where the relationships change. Within each of these regions, distinct alleles are labeled A1, A2, A3, etc. (B) Minimum recombination pathway to produce the observed virus isolates. Capsid identities are indicated by the serotype designations, CBV6, E1, E12, and X, where X is an unobserved strain of any HEV-B serotype, as described in the text. Regions and alleles are indicated as in panel A. Arrows pointing from right to left indicate minus strand synthesis and template switching to produce chimeric RNAs. (C) Coinfection of host 1 with strains V and W (recombination results in strain Y) and coinfection of host 2 with strains X and Y (recombination results in strain Z). Arrows between the parental strains indicate hypothetical template-switch points during minus strand synthesis.

