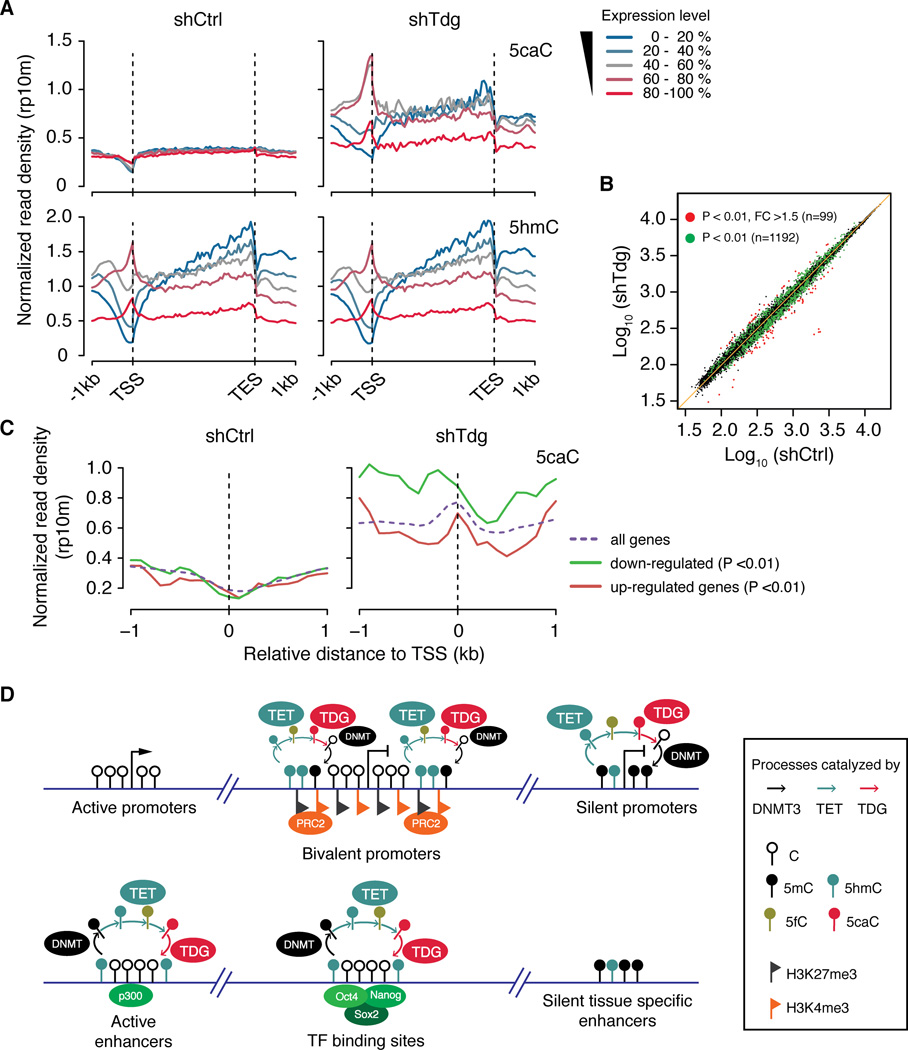
Figure 7. Complex relationship between gene expression and TET/TDG-mediated 5mC oxidation dynamics.
(A) Average signals of 5hmC and 5caC within genes expressed at different levels in control (left) and Tdg-deficient (right) mouse ESCs.
(B) Scatter plots comparing gene expression profiles of control and Tdg-deficient mouse ESCs. Green and red dots indicate differentially expressed genes at P < 0.01 and P < 0.01, FC >1.5, respectively.
(C) Average 5caC signals in control (left) and Tdg-deficient (right) mouse ESCs at the TSS of down-regulated and up-regulated genes (P < 0.01).
(D) Schematic diagram illustrating the relationship between transcriptional activity and DNMT/TET/TDG-mediated cytosine modification cycling at promoters and distal regulatory regions in mouse ESCs. Dynamic cyclic changes of cytosine modifications preferentially occur within bivalent and silent promoters, as well as active enhancers and pluripotency TF binding sites.
See also Figure S7.

