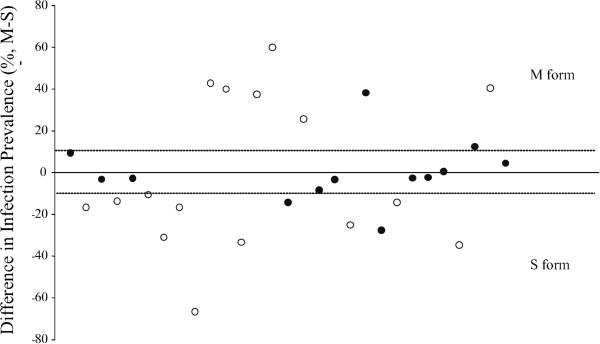
Figure 3.

Difference of infection prevalence between Anopheles gambiae M and S forms reveals greater accuracy for comparisons made within an infection. Each point is the ratio of infection prevalence between A. gambiae M and S form for a single experimental infection (n=29 infections). The y-axis is the difference in infection prevalence between molecular forms M and S fed on the same infectious blood meal, and the horizontal line at y=0 is the null average, where infection prevalence of the M and S forms are identical. Positive values indicate infections with greater infection prevalence in M form, and negative values indicate greater S-form infection prevalence. Infections are arranged temporally along the x-axis. Over the 29 infections, there is no significant difference between M and S form infection prevalence (see Results), despite the large variation observed between different infections. Closer examination shows that the subset of 13 most representative infections (closed circles) display less variation across infections, and are clustered closer to the null average than the remainder of infections (open circles) that have unbalanced representation of population groups within the same infection. Thus, 11/13 (85%) of the most representative infections are within 10% of the null average, while only 1/16 (6%) of the remaining less-representative infections are within 10% of the null average. This result strengthens the statistical absence of difference between M and S forms, and indicates that extraneous experimental noise is decreased when comparisons of mosquitoes within the same infection are maximized.
