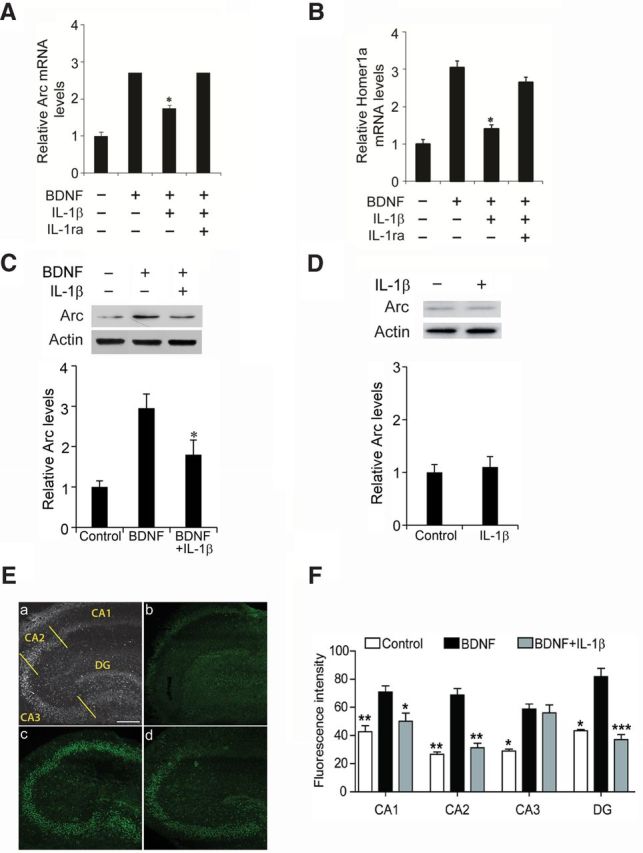
Figure 1.

IL-1β pretreatment decreased BDNF-induced Arc and Homer1a expression. Arc (A) and Homer1a (B) mRNA levels were determined by RT-PCR. Slices were exposed to BDNF (100 ng/ml, 1 h), IL-1β (50 ng/ml, 24 h pretreatment), and IL-1ra (5 μg/ml, 30 min before IL-1β) as indicated. Data are the mean ± SEM (n = 3) expressed in terms of control cultures. *p < 0.05 for BDNF versus BDNF plus IL-1β, ANOVA followed by the LSD post hoc test. Notably, IL-1ra blocked the suppression by IL-1β of BDNF-induced expression of Arc and Homer1a. C, Representative Western blots showing that pretreatment with IL-1β suppressed the effect of BDNF (100 ng/ml, 2 h) on Arc expression in CA1. Bottom row shows the quantification of Arc protein levels. Unless otherwise indicated, here and in the other legends, the quantification data for Western blots are expressed relative to the means in the control cultures (n = 3). *p < 0.05 BDNF versus BDNF plus IL-1β, ANOVA followed by the LSD post hoc test. D, IL-1β alone (50 ng/ml, 24 h) did not affect the expression of Arc protein in CA1. E, BDNF-induced Arc expression was evaluated in CA1, CA2, CA3, and DG (as indicated in the left top, a) of 10 DIV hippocampal organotypic cultures. Scale bar, 300 μm. Figure shows representative slices from the different experimental conditions. Compared with control cultures (b), there was an increase in the fluorescence intensity when cultures were treated with BDNF (100 ng/ml; c). Notably, the BDNF-induced increase in staining was affected by a preincubation with IL-1β (100 ng/ml; d) in CA1, CA2, and DG but not in CA3. F, Quantification of the immunoreactivity of Arc (n = 3). *p < 0.05, **p < 0.01, ***p < 0.001 compared with BDNF (ANOVA followed by post hoc test).
