
Figure 3.
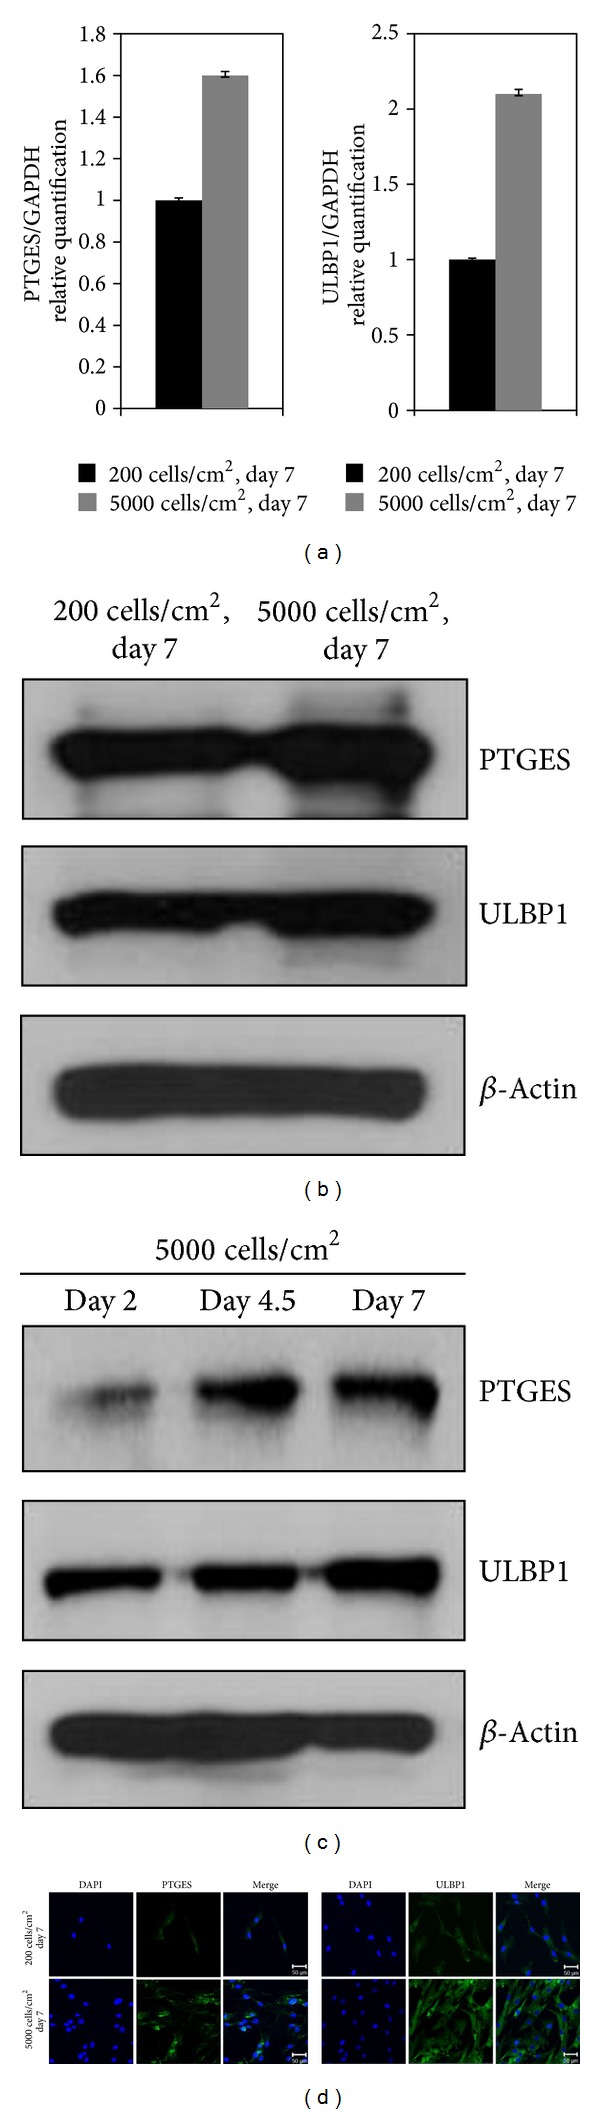
The expression levels of PTGES and ULBP1 in MSCs harvested at high cell density. (a) Quantitative RT-PCR analysis of selected genes upregulated in MSCs harvested at high cell density. (b) Immunoblot analysis of PTGES and ULBP1 protein expression in low and high density MSC cultures. β-Actin was used as a loading control. (c) Upregulated protein expression levels of PTGES and ULBP1 over time. (d) Immunocytochemistry showing higher expression of PTGES and ULBP1 in high versus low density MSCs. Scale bar: 50 μm. MSCs at passage 3 or 4 were used to validate the expression levels of PTGES and ULBP1. Each experiment was independently performed using different MSC preparations.