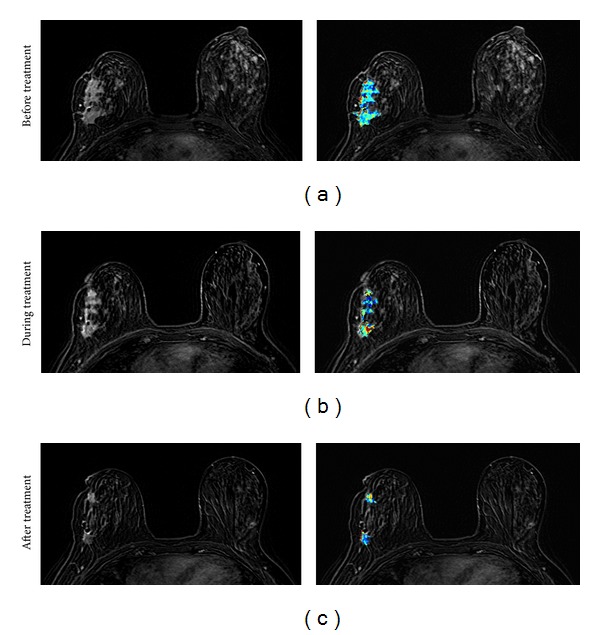
Figure 7.

A 41-year-old patient with non-mass-like enhancement lesion (invasive ductal cancer with lobular features). From (a) to (c), the contrast-enhanced (subtraction) images selected from the same level in pretreatment, F/U-1, and F/U-2 MRI are shown. The tumor boundary cannot be clearly determined, and thus the extent of the tumor cannot be measured precisely. While the disease extent does not change much in F/U-1, it is noticeable that the area of the enhanced tissues is smaller in F/U-2 after completing NAC. The right panel shows the corresponding color-coded K trans maps analyzed using pixel-by-pixel pharmacokinetic analysis within the enhanced tumor area, based on the unified Tofts model. It can be seen that the tumor breaks into two areas that show strong enhancements in F/U-2. The post-NAC pathological examination shows nearly continuous cancer clusters within a 6.5 cm region. It is typical for a non-mass lesion to show scattered diseases within the original tumor bed.
