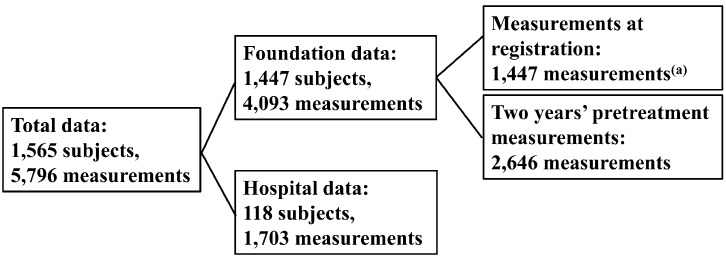
Fig. 1.
Total data for construction of the new charts with modification [2010] (5,772 measurements). Twenty-four outliers from 5,796 measurements were excluded for the final analysis. The new charts [2009] were constructed using 1,447 measurements (a) (7).

