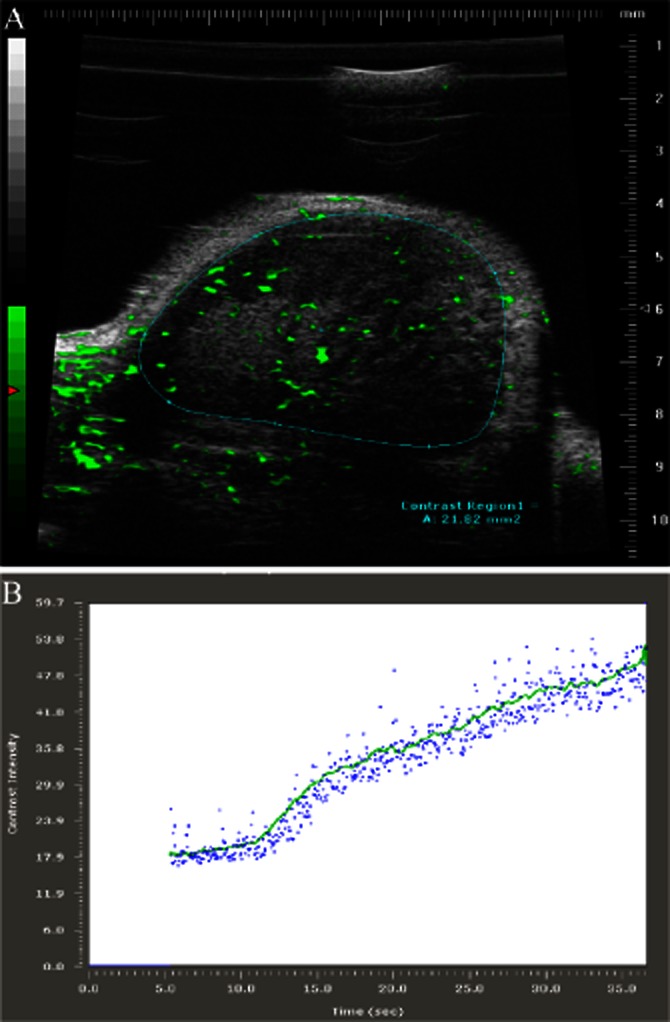
Figure 2.

Contrast-enhanced HF-US imaging. The use of microbubble contrast agents with HF-US imaging protocols allows the visualization and relative quantification of tumour blood flow and perfusion. (A) shows a contrast-enhanced HF-US image of an SW480 human colorectal cancer xenograft where microbubbles are coloured green and the region of interest (tumour) is delineated by the blue line. By imaging the contrast agent over time, both qualitative and quantitative data on tumour vascularity and tumour blood flow, respectively, can be obtained. (B) shows a wash-in time intensity curve where the contrast intensity in arbitrary units is plotted against time in seconds. Analysis of these curves provides values for the maximum intensity of the contrast agent or relative perfusion and the maximum relative rate of tumour blood flow.
