Figure 3.

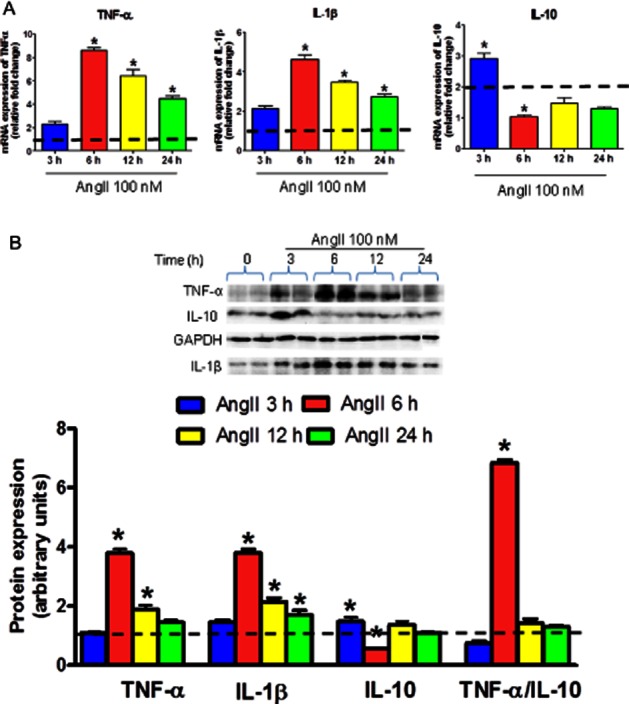
Effects of AngII treatment on TNF-α, IL-1β and IL-10 expression levels in neuronal cells. Serum-starved CATH.a cells were stimulated with 100 nM AngII for the indicated time. (A) mRNA expression of TNF-α, IL-1β and IL-10. (B) A representative Western blot and densitometric analysis of protein expression of TNF-α, IL-1β and IL-10. Quantitative Western blot analysis is shown as the ratio of intensities of the protein of interest and GAPDH, relative to unstimulated control cells (represented by the dashed line). AngII resulted in increased TNF-α and IL-1β, and reduced IL-10 levels indicating an imbalance between PIC and AIC in the CATH.a cells in time-dependent manner with maximum alterations at 6 h of AngII treatment. The results are means ± SD of three independent experiments (n = 6 per treatment groups in each experiment). *P < 0.05 compared to their respective vehicle-treated groups.
