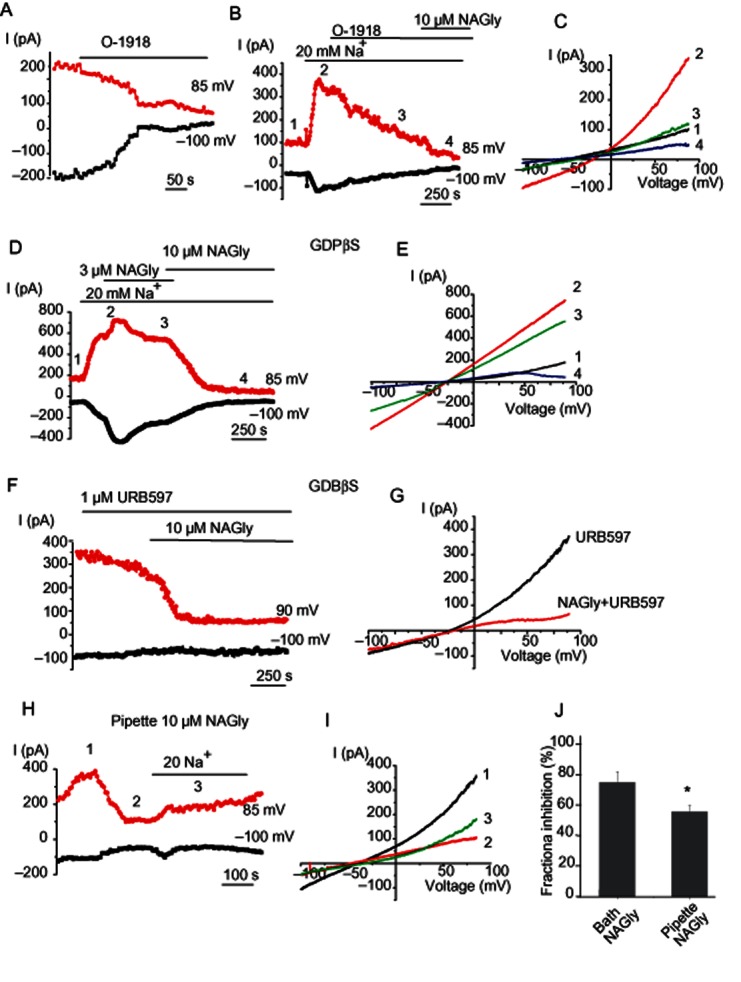
Figure 6.

NAGly suppresses NCX currents independently of G-proteins. (A) Representative time course of changes in NCX current amplitudes at −100 and +85 mV during voltage ramps before and during application of 10 μM O-1918. (B) O-1918 (10 μM) suppresses NCXpm current pre-stimulated with a decrease in bath Na+ to 20 mM. The time course of the response. (C) Corresponding current traces elicited by voltage ramps at time points indicated in (B). (D) Representative time course of changes in the NCXpm current amplitudes to voltage ramps at voltages indicated in the presence of GDPβS in the patch pipette under control conditions (1), in the presence of 20 mM Na+ in the bath (2) and in the presence of either 3 μM (3) or 10 μM (4) of bath NAGly in low Na+ solution. (E) Corresponding current traces at time points shown in (D). (F) Representative time course of changes in current amplitudes at −100 and +85 mV during voltage ramps before and during application of 10 μM NAGly in the continued presence of URB597. Pipette solution was supplemented with 0.5 mM GDPβS. (G) Corresponding I-V relationship. (H) Representative time course of the changes in current amplitude during intracellular dialysis of EA.hy926 cell with 10 μM NAGly before and after a decrease in bath Na+, (I) corresponding I-V relationship at time points indicated in (A). (J) Mean fractional inhibition of INCX at +85 mV by extracellular and intracellular NAGly (10 μM). Fractional inhibition was obtained using the function: fractional inhibition = (Icontrol − INAGly)/Icontrol × 100.
