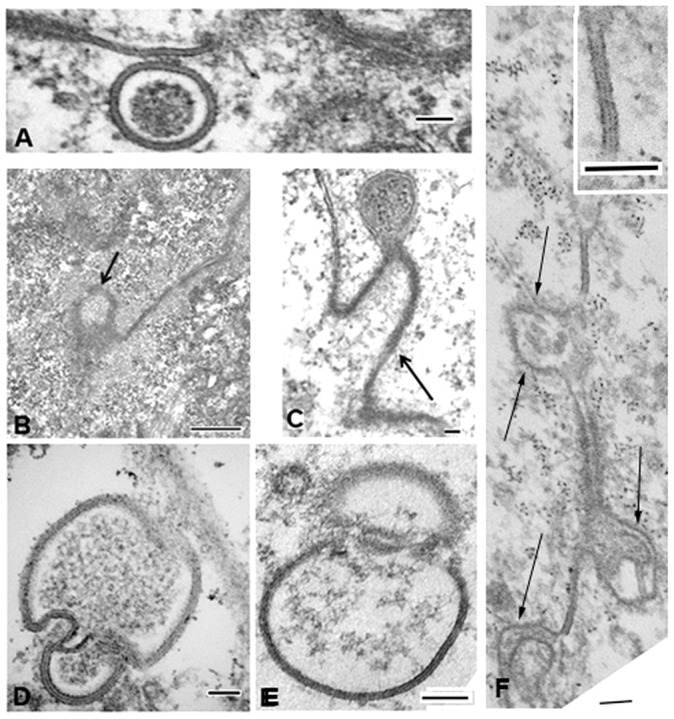
Fig. 3.

Gap junction plaques and annular gap junction vesicles in control and dynasore-treated cells. (A–F) Transmission electron microscopy images of gap junction plaques and annular gap junction vesicles in control (A,D,E) and dynasore-treated (B–F) populations. Note the annular gap junction vesicle near a gap junction plaque membrane in the control population (A). In the dynasore-treated populations, the invaginated gap junction plaque membrane is evident (arrows in B,C). Annular gap junctions can be seen in control populations which appear to be undergoing fission (D,E). (F) An image of the gap junction plaque in a dynasore-treated cell demonstrates numerous sites of apparent invagination (arrows). The typical gap junction membrane at sites that are not invaginated can be seen. Scale bars: 100 nm (A,C–F); 500 nm (B).
