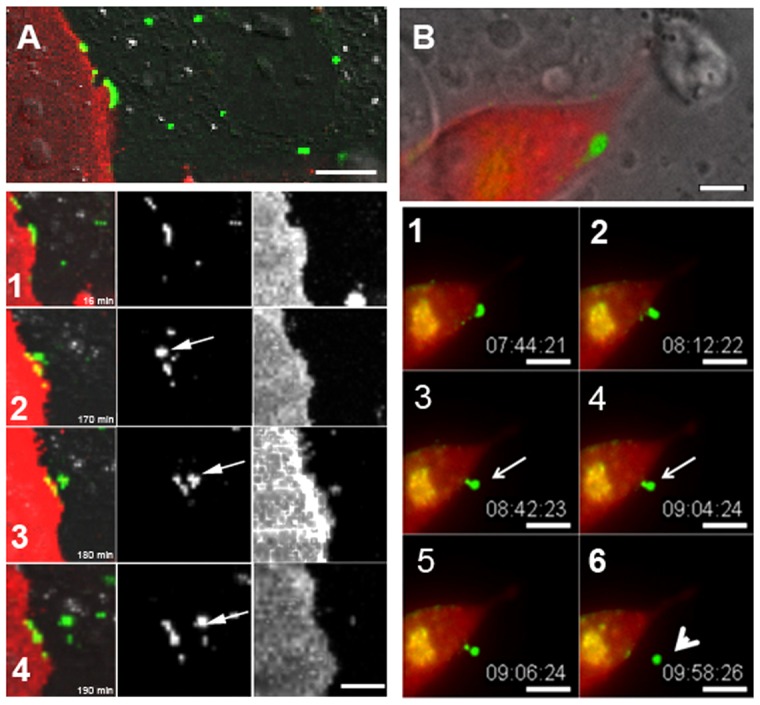
Fig. 4.

Time-lapse imaging montage of gap junction plaque endoexocytosis. (A,B) Upper DIC images show gap junction plaques at time zero. Numbered images below show the gap junctions at the times indicated. Note the internalization of the gap junction plaque (Cx43-GFP) into a cell that is not labeled with the membrane marker, RFP-tagged pCS2 (A) or not expressing the clathrin-mCherry (B). The presence of tagged pCS2 (A) or clathrin (B) in one of the two contacting cells and the absence of that marker in the other cell, as well as the DIC images (A,B) allow delineation of the cell borders. Note that the gap junction plaque in A (arrow in A2) is internalized to form an annular gap junction (arrow in A4) and that a small amount of the cell marker is seen within the annular gap junction vesicle. The gap junction plaque seen in B presumably had already started to invaginate at the time it was selected for time-lapse imaging. The gap junction plaques in B can be seen to invaginate to form a U-shaped projection (B2), which becomes constricted at the neck to result in a bud (arrows in B3,B4) that then is released to form an annular gap junction vesicle (arrowhead) (B6). See supplementary material Movie 1. Scale bars: 10 µm (A,B).
