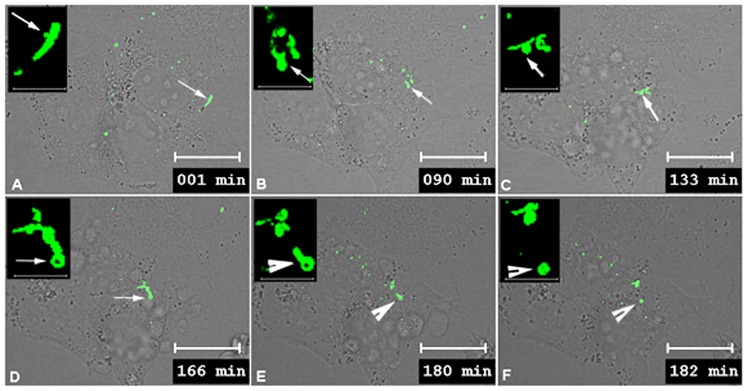
Fig. 6.

Montage time-lapse images demonstrating the recovery from dynasore inhibition of internalization. (A–F) The cells were imaged for 30 minutes prior to dynasore treatment and then treated for 1 hour with dynasore. For the analysis of recovery, dynasore was washed out. Prior to dynasore treatment, a linear gap junction plaque with a small bud attached was selected for collecting images (arrow) (A). Multiple large gap junction bud-like structures were observed protruding from the gap junction plaque during dynasore treatment (arrows) (B). Once dynasore was washed out and replaced with growth media, one of the buds that could be tethered to the gap junction plaque (C) was seen to internalize and form an annular gap junction (arrowhead) (E,F). See supplementary material Movie 4. Scale bars: 20 µm (A–F); 5 µm (insets).
