Fig. 7.
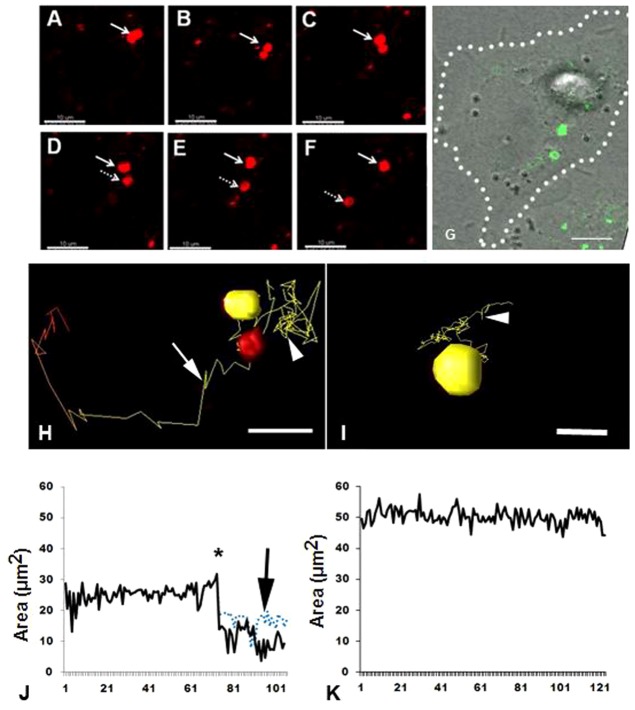
Monitoring of annular gap junction vesicles and visualization of fission events. (A–F) Time-lapse imaging montage of annular gap junction vesicle splitting. (G) Corresponding Cx43-GFP/DIC overlay image of E in which the cell border has been delineated by the dotted line. Note the fission of an annular gap junction vesicle in a control cell, which results in the formation of two smaller annular gap junction vesicles. (H,I) The track taken by the annular gap junction vesicles were followed in control (H) and dynasore-treated cells (I). In H, the annular gap junction vesicle has already split into two smaller annular gap junctions in the control cell. Once the split occurred, one of the vesicles (yellow) continued to move in a Brownian-type pattern (arrowhead), while the second vesicle (red) took a more directional path (arrow). In I, the annular vesicle did not undergo fission and moved in a Brownian-type pattern (arrowhead). (J,K) Corresponding graphical representations of annular gap junction vesicle size. Vesicle size (area, µm2) was monitored over time and the control cell (J) decreased at the time corresponding to vesicle fission (asterisk). The size of annular vesicles before and after fission (blue dotted line and black solid line, respectively) is demonstrated. In the dynasore-treated cell (K), the annular vesicle remained constant in size. See supplementary material Movies 5 and 6. Scale bars: 10 µm (A–G); 5 µm (H,I).

