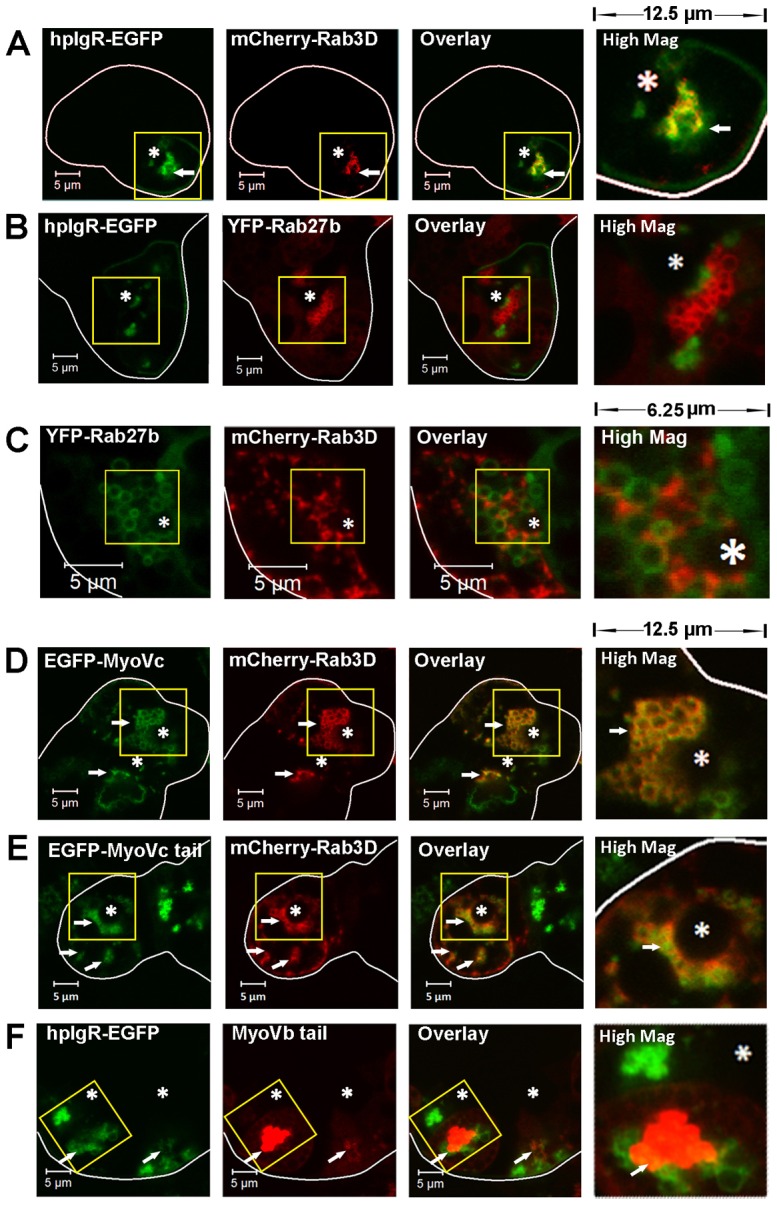
Fig. 5.

The distribution of hpIgR-EGFP in the regulated secretory pathway and the transcytotic pathway. Live LGACs co-expressing fluorescent fusion proteins were imaged by confocal fluorescence microscopy to show localization patterns of various markers. Cellular outlines were obtained by differential interference contrast imaging. (A) hpIgR-EGFP colocalized with mCherry-Rab3D. (B) The hpIgR-EGFP-enriched compartment was distinct from YFP-Rab27b-enriched SVs. (C) YFP-Rab27b-enriched SVs were distinct from mCherry-Rab3D-enriched SVs. (D) EGFP-myosin Vc was enriched in the mCherry-Rab3D-enriched SVs. (E) EGFP-myosin Vc tail colocalized with the membrane compartment labeled by mCherry-Rab3D. (F) hpIgR-EGFP partially colocalized with mCherry-myosin Vb tail. The high magnification image displays a region of 12.5×12.5 µm (A,B,D,E,F) or 6.25×6.25 µm (C) from the yellow boxed image to the left. White arrows, colocalization between red and green; *, lumena. Scale bars: 5 µm.
