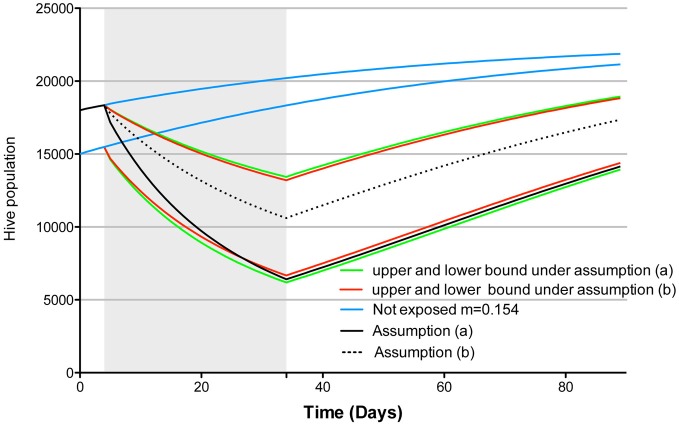
Figure 1.
Simulation of the Khoury et al. (2011) population dynamic model as implemented by Cresswell and Thompson (2012)2, model parameters were w = 27.000, L = 2000, α = 0.25, σ = 0.75 [as per Henry et al. (2012)], starting hive population was 18,000 (lower bound) or 15,000 (upper bound), pesticide exposure condition assumed the extreme case of 100% foragers exposed. The shaded area corresponds to the exposure period. In blue the projected population growth under a non exposure scenario, in green and red the projected population dynamic under assumptions (a) and (b), respectively, based on Henry et al. (2012) experimental results. Black continuous and dotted line show model projection under assumption (a) and (b) respectively, assuming a normal homing failure of 0.154 individuals.day−1, based on experimental results showing 0.7 and 0.42 individuals.day−1 homing success in the control and treatment respectively (starting population of 18000 individuals).

