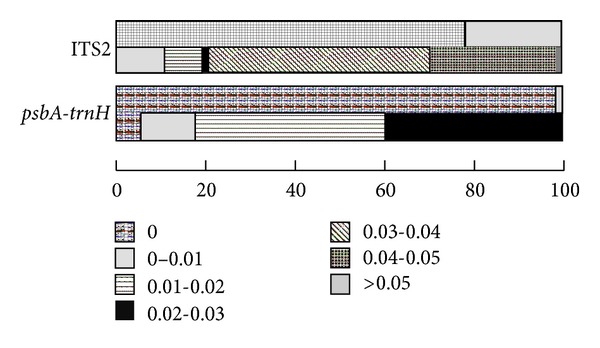
Figure 2.

Relative distribution of inter-specific divergence between Flos Lonicerae Japonicae and intra-specific variation for ITS2 and psbA-trnH sequences. The two bars in the box represent intra-specific (above) and inter-specific (below) genetic distances.
