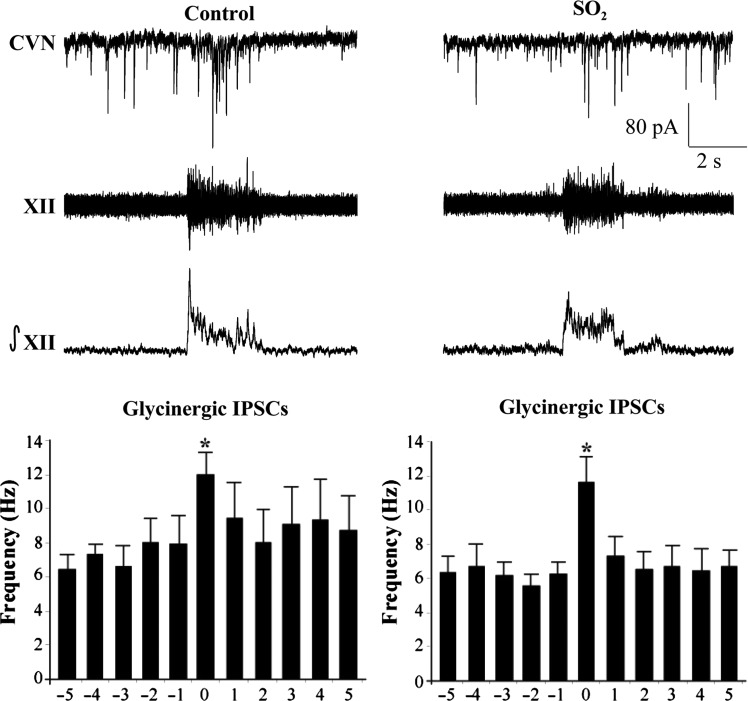
Figure 3.
The bursting pattern of the hypoglossal rootlet (XII) was electronically integrated (∫XII) and glycinergic IPSCs were recorded simultaneously in CVNs (top traces). There was a significant increase in IPSC frequency during the inspiratory phase in both conditions; however, there were no differences between control and SO2-exposed animals during either the spontaneous (control, 7.2 ± 1.0 Hz; SO2, 6.1 ± 0.8 Hz) nor inspiratory periods (control, 11.9 ± 1.3 Hz; SO2, 11.6 ± 1.5 Hz), as shown in the histogram (control, n = 4 animals; SO2, n = 5 animals; *P < 0.05).

