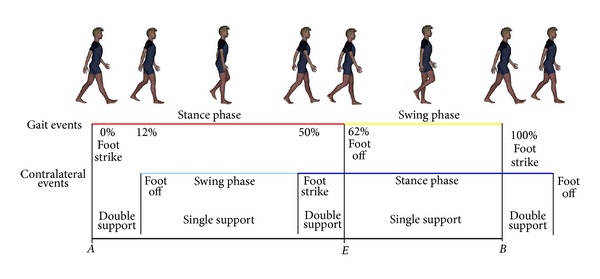
Figure 1.

The gait cycle. A schematic representation of gait cycle with stance (red) and swing (yellow) phases showed in the above line, whereas the line drawn in middle reported the gait cycle of the contralateral limb with swing (light blue) and stance (blue) phases. The black line drawn below showed the link with the Euclid's problem to cut a straight line (AB) so that the proportion between the shorter part (EB) to the longer one (AE) is the same as the longer part (AE) to the whole (AB).
