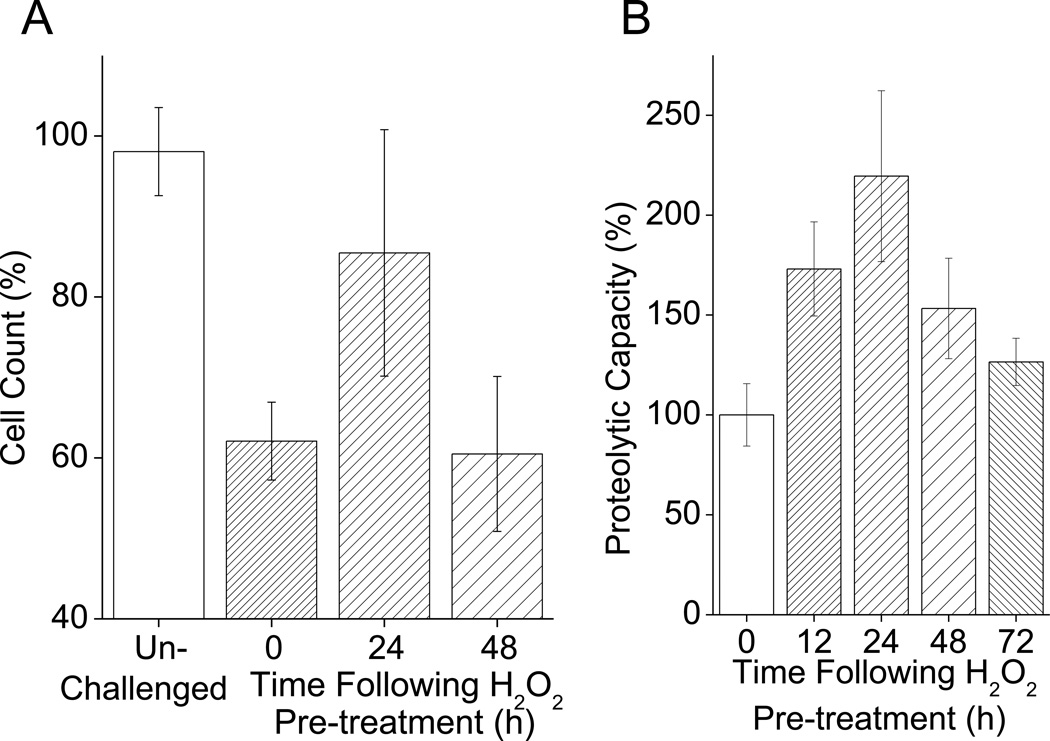
Fig. 2. H2O2 Pretreatment Causes a Transient Adaptive Response.
H2O2 pretreatment transiently enhances resistant to subsequent H2O2 challenge and increases cellular proteolytic capacity, but cells return to a naïe state 48–72 h after H2O2 pretreatment. A. With H2O2 pretreatment oxidative stress tolerance increases for 24 h, then returns to baseline levels. Cells were prepared and pre-treated as in Fig. 1. Cells were then challenged either 24 or 48 h after pretreatment. Cell counts were taken 24 h after challenge. Values are plotted as a percent of the cell counts of samples which were not exposed to the challenge and are shown as means ± SE, where n = 4. The values for unchallenged samples and 0 h pretreated samples, represent data pooled from cell counts taken 24 and 48 h after pre-treatment. B. With H2O2 pre-treatment, proteolytic capacity increases in the 24 h after pre-treatment but returns to baseline levels over the succeeding 72 h. Cells were prepared and pretreated as in Fig. 1. Samples were then collected 12, 24, 48 and, 72 h after H2O2 pretreatment. Samples were then lysed and proteolytic capacity determined through degradation of Suc-LLVY-AMC. Values are means ± SE, where n = 3. The values for 0 h pretreated samples represent the activity of non pretreated cells taken 12 h after H2O2 pretreatment.

