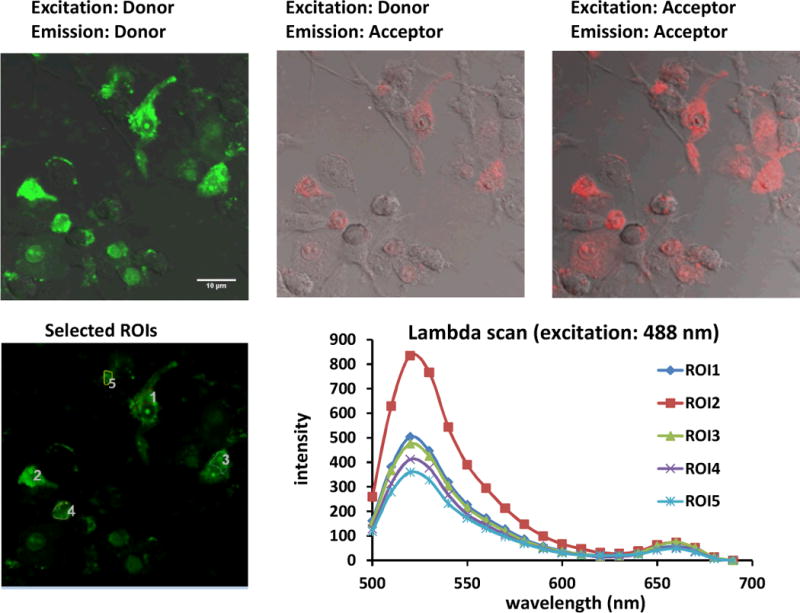
Fig. 5.

Confocal images of stimulated RAW 264.7 cells treated with iNOS PNA•DNA FRET probes. Cells were stimulated with LPS and γ-IFN and then again after 18 h at which point they were also treated with 0.5μM FAM-PNA•DNA, 0.5 μM PNA-Cy5•DNA and 14.5 μg/mLc SCK at an N/P ratio of 8. The cells were incubated for an additional 24 h before confocal microscopy. Green channel: FAM emission, red channel: Cy5. The first two panels show images resulting from excitation at 488 nm, while panel C shows and image following excitation at 633. The second panel shows the FRET emission at 660 nm resulting from excitation at 488 nm. The fourth panel shows regions of interest (ROIs) from which the emission spectra shown in the last panel were obtained.
