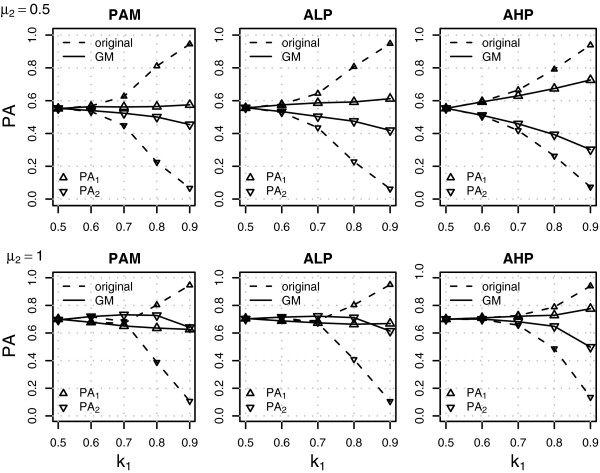
Figure 2.
Classification results under the alternative hypothesis for the NSC and GM-NSC classifiers. The figure shows class specific predictive accuracies (PA1 and PA2) for different levels of class-imbalance (k1) in the training set. The differences between the classes were small (upper panel: μ2=0.5) or moderate (lower panel: μ2=1). See text for details.

