
Figure 3.
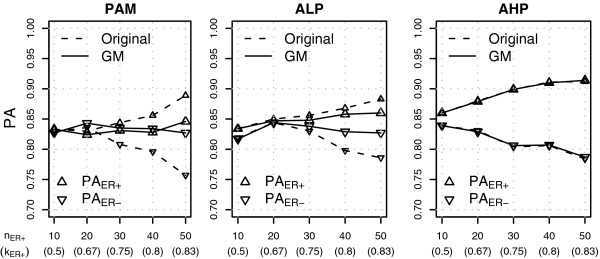
Classification results on the Sotiriou data set. The figure shows PA for ER+ class (PAER+) and PA for ER- class (PAER-) for different number of ER+ samples in the training set (nER+). There were 10 ER- samples in each training set. See text for more details.