FIG. 1.
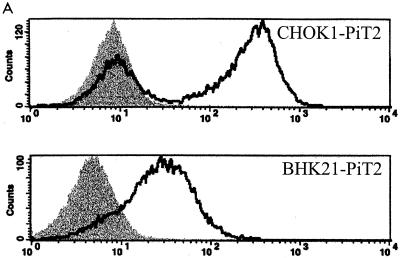
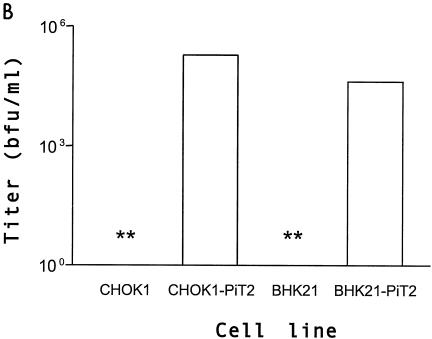
Comparison of CHOK1 and BHK SN-10 cells stably expressing the human ortholog of PiT2. (A) Flow cytometric histograms of HA-tagged A-MuLV RBD binding. Binding was carried out at 4°C as described in Materials and Methods, followed by incubation with 5 μg of HA.11 monoclonal antibody, recognizing HA-tagged soluble A-MuLV SU, per ml. Bound tag was detected with goat anti-mouse antibody-fluorescein isothiocyanate (1:50). Shaded areas correspond to negative control cells exposed to HA-tagged A-MuLV SU; areas beneath bold lines correspond to CHOK1 or BHK SN-10 cells stably expressing PiT2 receptors exposed to HA-tagged A-MuLV SU. (B) A-MuLV titers expressed as BFU per milliliter ± the standard errors of the means from at least three independent experiments. **, titer results were zero.


