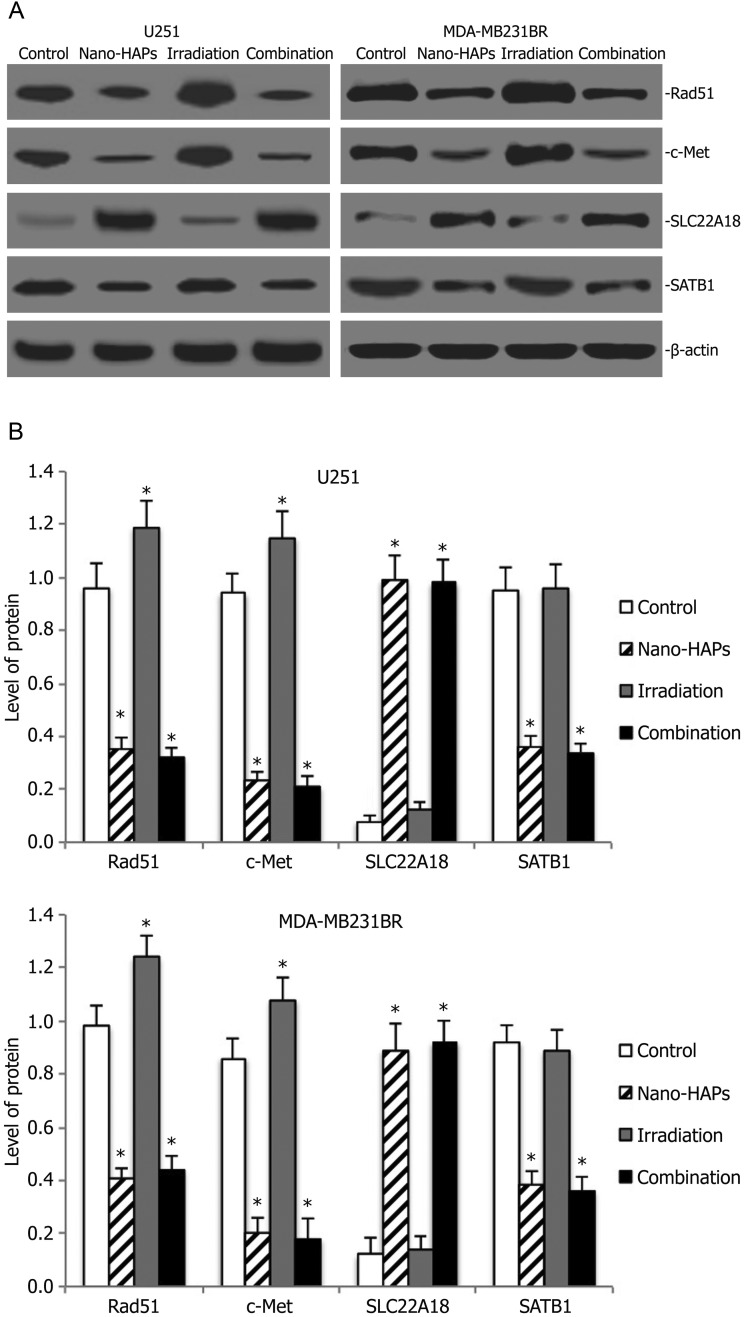
Fig. 6.
Western blot analysis for Rad51, c-Met, SLC22A18, and SATB1 expression of orthotopic xenograft from the sham-treated control animals and animals that had received nano-HAPs or irradiation or their combination. (A) Representative images of Western blot analysis. β-actin was used as loading control. (B) Level of Rad51, c-Met, SLC22A18, and SATB1 expression. *P < .05 vs control.

