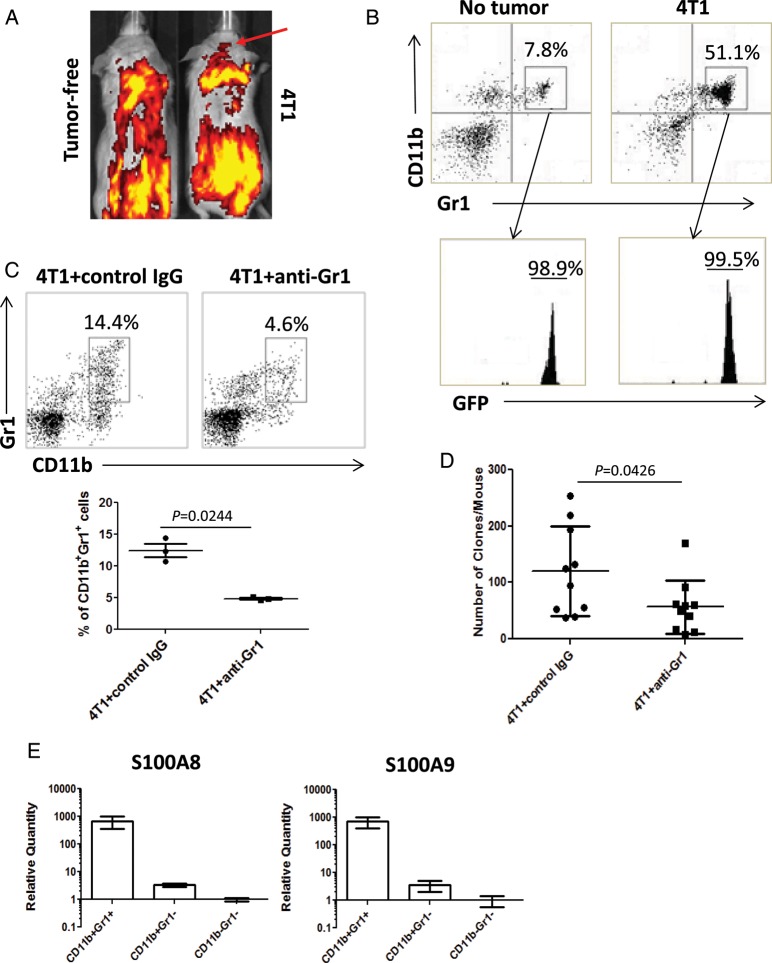
Fig. 2.
BM-derived IMCs promote brain metastasis. (A and B) Mice chimeric with EGFP+ BM cells with or without 4T1 tumors. (A) In vivo imaging of EGFP signals on day 14 after 4T1 cell (right) or control saline (left) injection. (B) CD11b+Gr1+ BILs in tumor-free (left) or 4T1-bearing (right) mice on day 14. CD11b+Gr1+ BILs were EGFP+ (bottom panels). (C and D) Mice bearing 4T1 tumors were treated with anti-Gr1 mAb or control IgG. (C) CD11b+Gr1+ BILs in mice treated with control IgG (left) or with anti-Gr1 mAb (right) on day 14 (n = 5/group). The number in each histogram indicates the percentage of CD11b+Gr1+ cells (upper panels). The graph shows the percentage of CD11b+Gr1+ cells in 3 repeated experiments. (D) Clonogenic assays with the brains of mice bearing 4T1 tumors of day 30 treated with anti-Gr1 mAb or control IgG (n = 10/group). (E) CD11b+Gr1+, CD11b+Gr1−, and CD11b−Gr1− populations of the day-14 BILs were evaluated for expression levels of S100A8 and S100A9 by real-time PCR (7 mice). Boxes and bars indicate range of mean values in 2 independent experiments.

