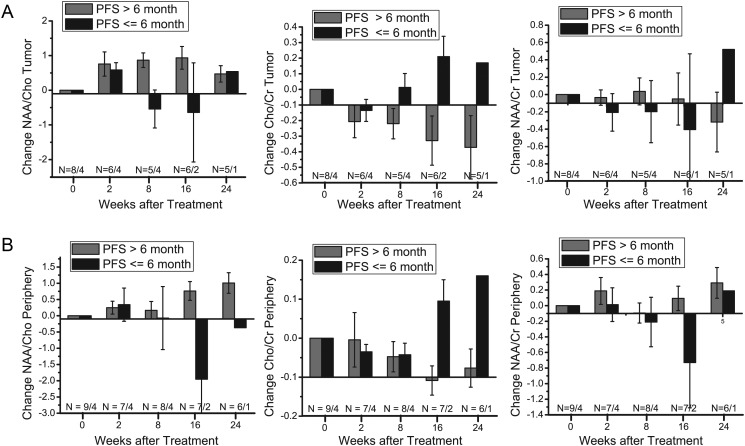
Fig. 3.
(A) Changes in NAA/Cho, Cho/Cr, and NAA/Cr from baseline in tumor voxels grouped by PFS-6 survivors (PFS >6 mo) and non–PFS-6 survivors (PFS ≤ 6 mo). (B) Changes in NAA/Cho, Cho/Cr, and NAA/Cr from baseline in peritumoral voxels grouped by PFS-6 survivors (PFS >6 mo) and non–PFS-6 survivors (PFS ≤ 6 mo). Error bars represent SEs of the mean. Numbers of patients are noted on the bottom.

