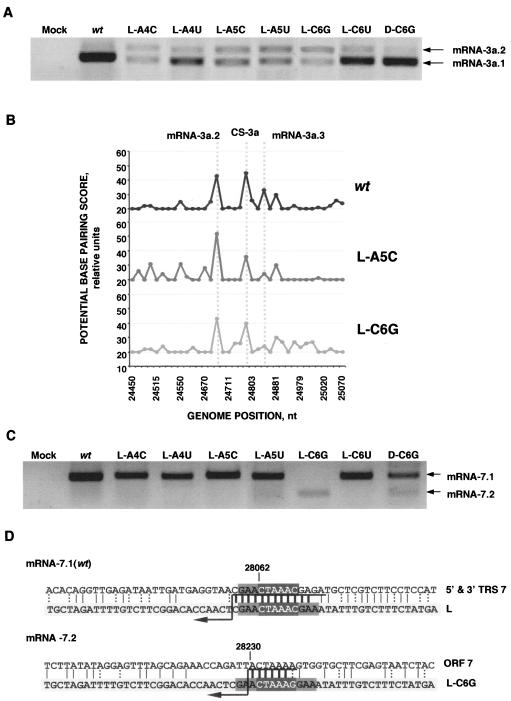
FIG. 10.
Analysis of 3a and 7 sgmRNAs present in leader mutants. (A) mRNA-3a detection by RT-PCR. sgmRNA species are named as mentioned before. (B) In silico analysis of the identity between the wild-type (wt) or mutated TRS-L and the TGEV genome surrounding the 3a gene CS. Data are graphically plotted as potential base-pairing score versus the genome position. (C) mRNA-7 detection by RT-PCR. The sgRNA species are named mRNA 7.1 and 7.2. (D) Sequence analysis of the leader-to-body junction sites in all of the 7 gene sgRNAs generated. The sequence at the bottom (light-gray box) represents the wild-type or mutated leader, and the one on top represents the gRNA in the fusion site context. CS is in white letters in a dark-gray box. Vertical bars show the identity between the sequences, and thick bars represent the possible fusion site, because strand transfer should occur in any of the nucleotides above the arrow. Dotted vertical bars represent the possible non-Watson-Crick interaction. Numbers indicate the position in the TGEV genome.

