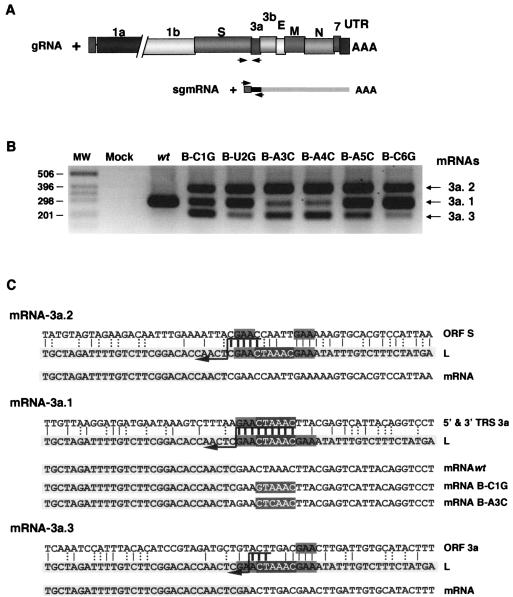
FIG. 4.
RT-PCR analysis of the CS-B mutants. (A) Scheme of the RT-PCR strategy for testing the gRNA and the mRNA-3a. Arrows indicate the approximate oligonucleotide position in the genome and sgmRNA. UTR, 3′ untranslated region. (B) mRNA-3a specific RT-PCR products were resolved in an agarose gel. mRNA-3a species were numbered 3a.1 (wild type [wt]), 3a.2, and 3a.3. MW, molecular weight markers. (C) Sequence analysis of the leader-body junction sites in the three mRNA-3a species. The sequence in the light-gray box corresponds to the leader (L) sequence. The CS appears as white letters in a dark-gray box in all cases. The sequence on top corresponds to the gRNA sequence in the fusion site; the sequence at the bottom is the mRNA sequence with nucleotides from the leader in a light-gray box. CS in white letters in a dark-gray box represents the mutated CS in each case; two examples of leader-to-body junction sites generating mRNA-3a.1 are presented: the B-C1G and B-A3C mutants. The GAA motif appears in a medium-gray box. Vertical bars represent the identity between the sequences, with thick bars at the possible fusion site. Dotted vertical bars represent the possible non-Watson-Crick interaction. Crossover should occur in any of the nucleotides above the arrow.

