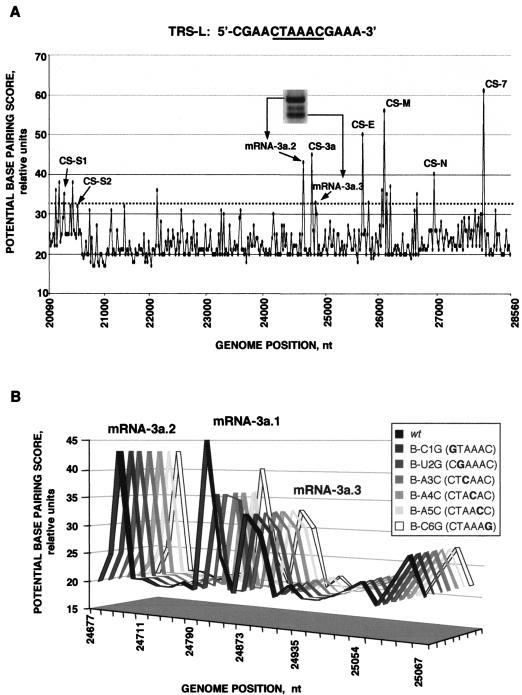
FIG. 6.
In silico analysis of the identity between TRS-L and the TGEV genome. As indicated in Materials and Methods, a continuous line graph was selected to facilitate visualization of the data. (A) Graphical plot of the potential base-pairing score versus the genome position. All peaks assigned to the viral CSs are indicated as the peaks corresponding to the new 3a sgmRNA species. (B) Graphical plot of the potential base-pairing score versus the genome position around CS-3a. Each three-dimensional line represents either the wild-type (wt) situation or the body mutants. The peaks assigned to each 3a sgmRNA species are indicated.

