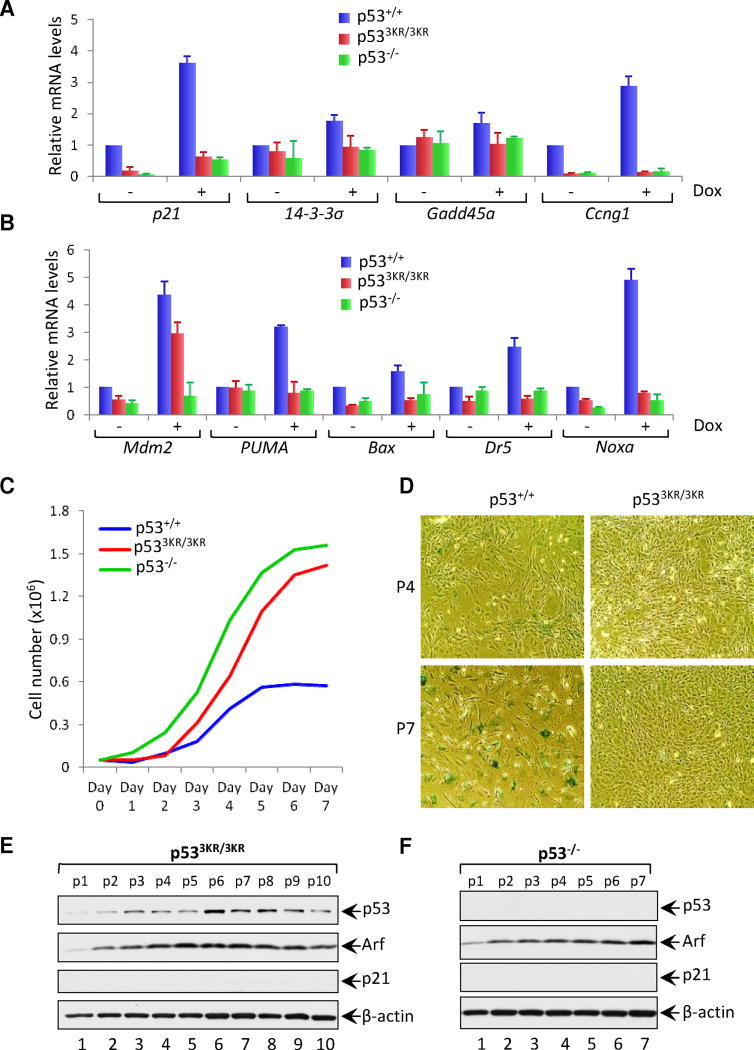
Figure 5. p533KR Loses Its Ability to Induce Cellular Senescence in p53 3KR/3KR MEFs.
(A and B) qRT-PCR analysis of indicated mRNAs in p53+/+, p533KR/3KR and p53−/− MEFs either untreated or treated with 0.2 μg/ml Dox for 8 hours. Results shown are the relative amount of specific mRNA normalized first to β-actin and then to the untreated wildtype sample values from three independent experiments with different MEF lines. Error bars represent ± SEM.
(C) Cell growth rate analysis of p53+/+, p533KR/3KR and p53−/− MEFs. 3 × 10⁴ MEFs of different genotypes were seeded into 6-well plates at day 0 and counted daily.
(D) Images of SA-β-gal staining of p53+/+ and p533KR/3KR MEFs at different passages cultured according to the 3T3 protocol. MEFs at indicated passages were fixed and stained for β-galactosidase activity.
(E and F) Immunoblot analysis of p53, Arf and p21 in p533KR/3KR (E) and p53−/− (F) MEFs at indicated passages cultured according to the 3T3 protocol. β-actin serves as a loading control.
See also Figure S7.

