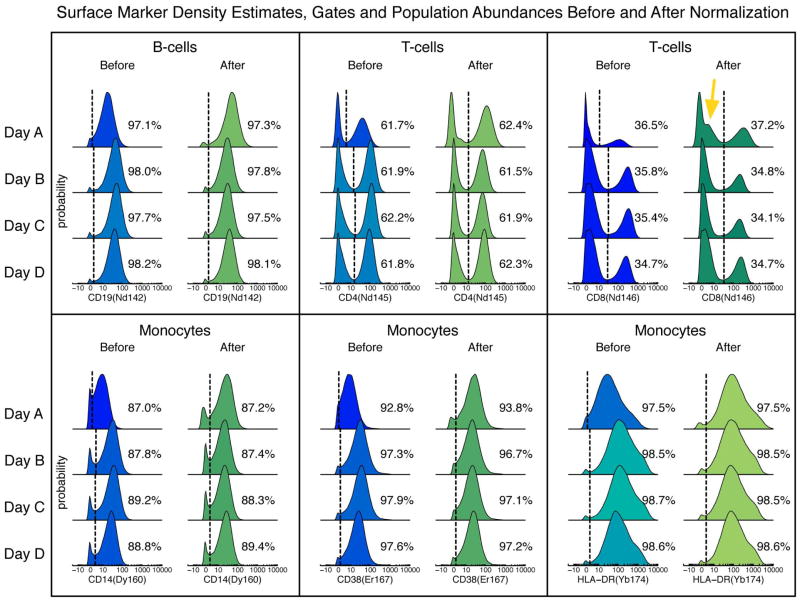
Figure 4. Distributions of surface markers before and after bead normalization.
Density estimates of selected markers in various populations before and after bead normalization in the same sample measured on four different days. Binary gates (dotted lines) were manually tailored to each of the four files separately before normalization, and global gates were drawn after normalization. The percentages of the cells in the positive gates are shown.

