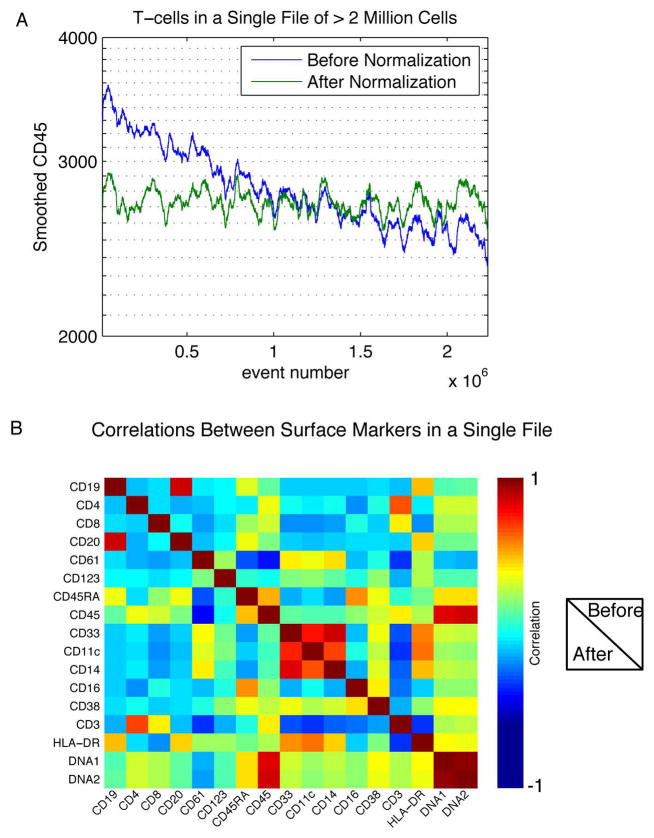
Figure 5. Normalization stabilizes surface marker intensities over time and maintains multivariate correlations between markers.
(A) A sample of > 2 million cells was measured in a single acquisition acquired over a period of >2 hours. The smoothed CD45 intensity of CD3+ cells is shown before and after bead normalization. (B) The pairwise correlations between cell surface markers in a single file were calculated and displayed here as a heatmap. The correlations before and after normalization are shown in the upper-right and lower-left triangles of the plot, respectively. The values on the diagonal are the correlations between a single parameter with itself before and after normalization.

