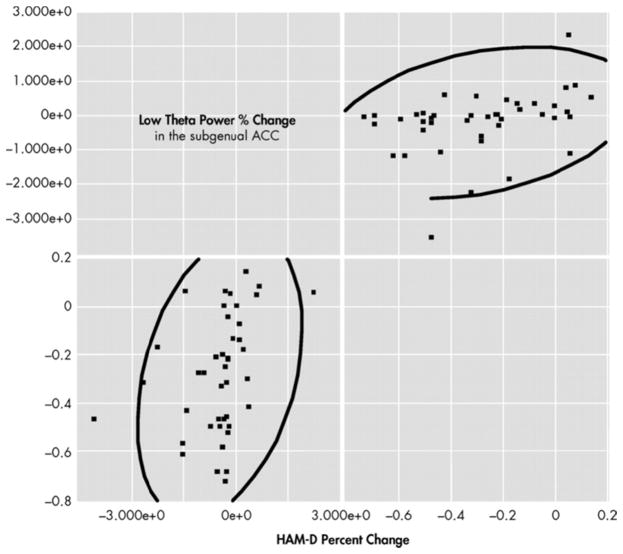
Figure 4. Correlation Between Subgenual ACC Low Theta Power Percent Change and HAM-D Percent Change.
Scatterplot demonstrating that there is a significant and positiv ve correlation between % changes in low-theta power in the subgenual ACC and total HAM-D among participants with active rTMS (Spearman ρ=0.45, p<0.01).
HAM-D=Hamilton Depression Rating Scale; ACC=anterior cingulate cortex

