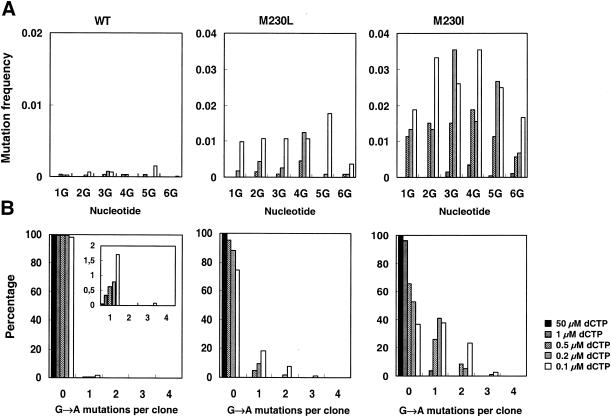
FIG. 1.
Frequency distribution of G→A transitions at specific sites of the tryptophan trap. (A) Frequency distribution for reactions performed with WT RT and the mutant RTs with M230L and M230I. The six G sites indicated correspond to the second and third bases of the Trp codons as they appear in the RNA template (read from the 5′ to the 3′ end). (B) Number of G→A transitions per clone obtained with the three RTs. With decreasing dCTP concentrations, the number of highly mutated clones (containing two or three G→A transitions) increased, particularly in the case of the mutant RT with M230I. Mutated clones were rarely found with the WT RT and represented less than 2% of the total number of clones analyzed (data shown in the insert).

