Figure 3.

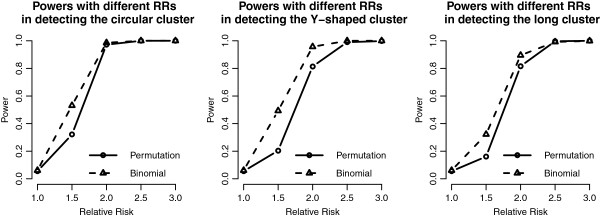
Power curves of the proposed methods in the 20 by 20 grid area. Power curves of the proposed methods with different RRs and cluster shapes in the 20 by 20 grid area. Note that the value represents the type I error when RR = 1.

Power curves of the proposed methods in the 20 by 20 grid area. Power curves of the proposed methods with different RRs and cluster shapes in the 20 by 20 grid area. Note that the value represents the type I error when RR = 1.