Figure 9.

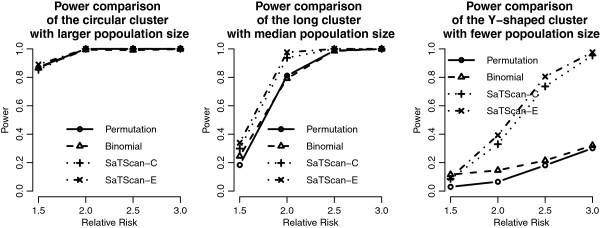
Power comparisons in Taiwan geographical region. Power comparisons of the proposed methods and the SaTScan methods with different RRs and cluster shapes in Taiwan geographical region.

Power comparisons in Taiwan geographical region. Power comparisons of the proposed methods and the SaTScan methods with different RRs and cluster shapes in Taiwan geographical region.