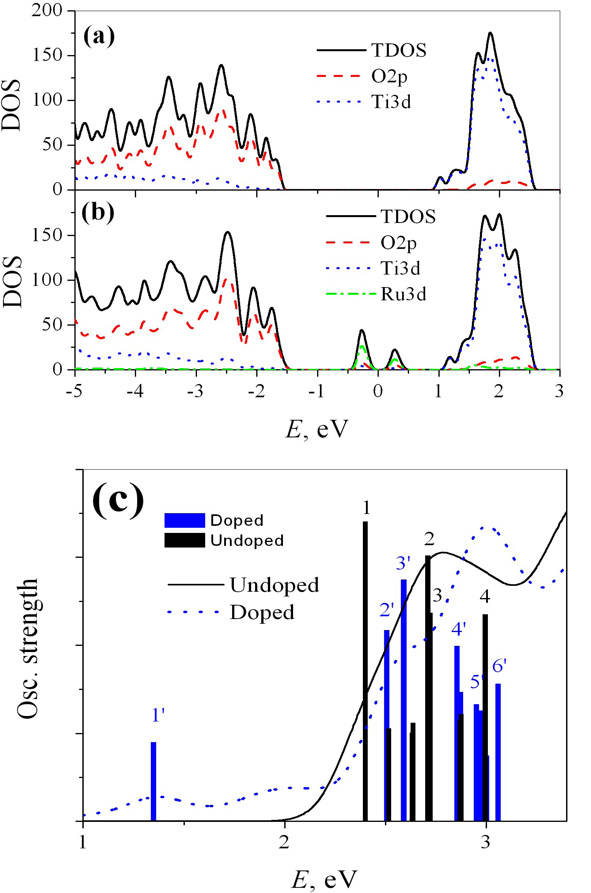
Figure 2.
Basic electronic structure features for doped and undoped TiO2 anatase (100) surface. Panel a, b show comparison of total density of states (lines) and partial density of states components on O2p (long dashes), Ti3d (short dashes), and Ru4d (dot-dashes) for undoped a and doped b models. Undoped surface has a bandgap of over 2 eV. Doped surface shows states contributed by doping in the bandgap area. Part of Ru-doping-related states are populated. Panel c shows absorption spectra of undoped (solid) and doped (dashes) models. Electronic transitions contributing at most to the doped model are represented by vertical stems with heigh equal to their oscillator strength. Labels of individual excitations are consistent with scheme in Fig. 1 and notations in Tables 2, 3.

